- 1 1. What Is an RSI Strategy in MQL5?
- 2 2. How to Implement an RSI Strategy in MQL5
- 3 3. How an RSI Strategy Works
- 4 4. Differences Between an RSI Strategy and Other Methods
- 5 5. Common Mistakes and Cautions
- 6 6. Practical Use Cases
- 7 7. Frequently Asked Questions (FAQ)
- 7.1 7.1 What Is the Best RSI Period?
- 7.2 7.2 Can RSI Be Used Alone?
- 7.3 7.3 Are RSI 30/70 Levels Fixed?
- 7.4 7.4 What Is the Difference Between RSI and MACD?
- 7.5 7.5 In What Markets Does RSI Not Work?
- 7.6 7.6 Is Backtesting Enough?
- 7.7 7.7 Can RSI Be Used for Scalping?
- 7.8 7.8 Is RSI or Bollinger Bands Better?
1. What Is an RSI Strategy in MQL5?
Conclusion:
An RSI strategy is a simple automated trading logic that uses RSI values as conditions for buy and sell decisions.
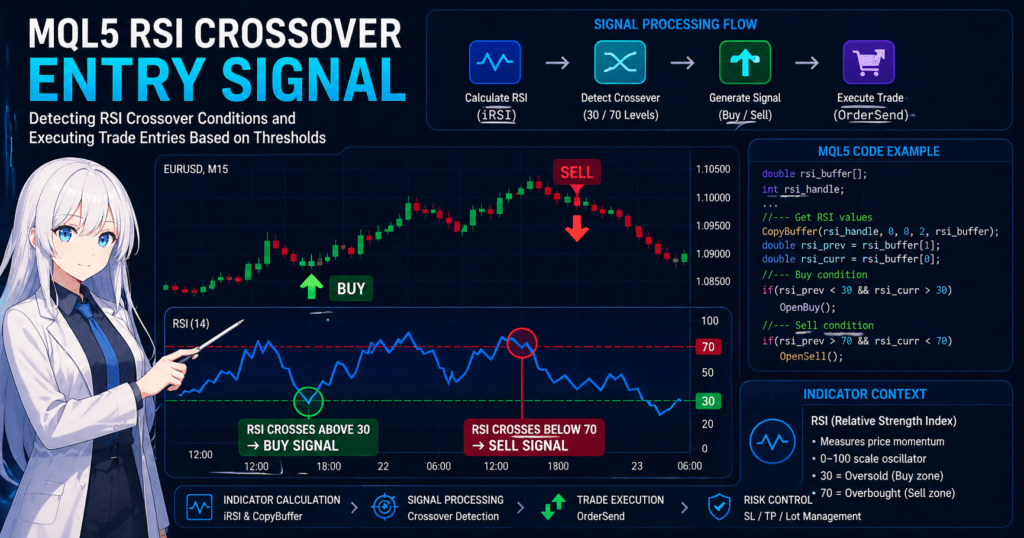
In MQL5, you can build reproducible entry decisions by using iRSI and CopyBuffer.
1.1 What Is RSI?
Conclusion:
RSI is an indicator that converts the strength of price rises and falls into a number, then helps judge whether the market is overbought or oversold.
Definition:
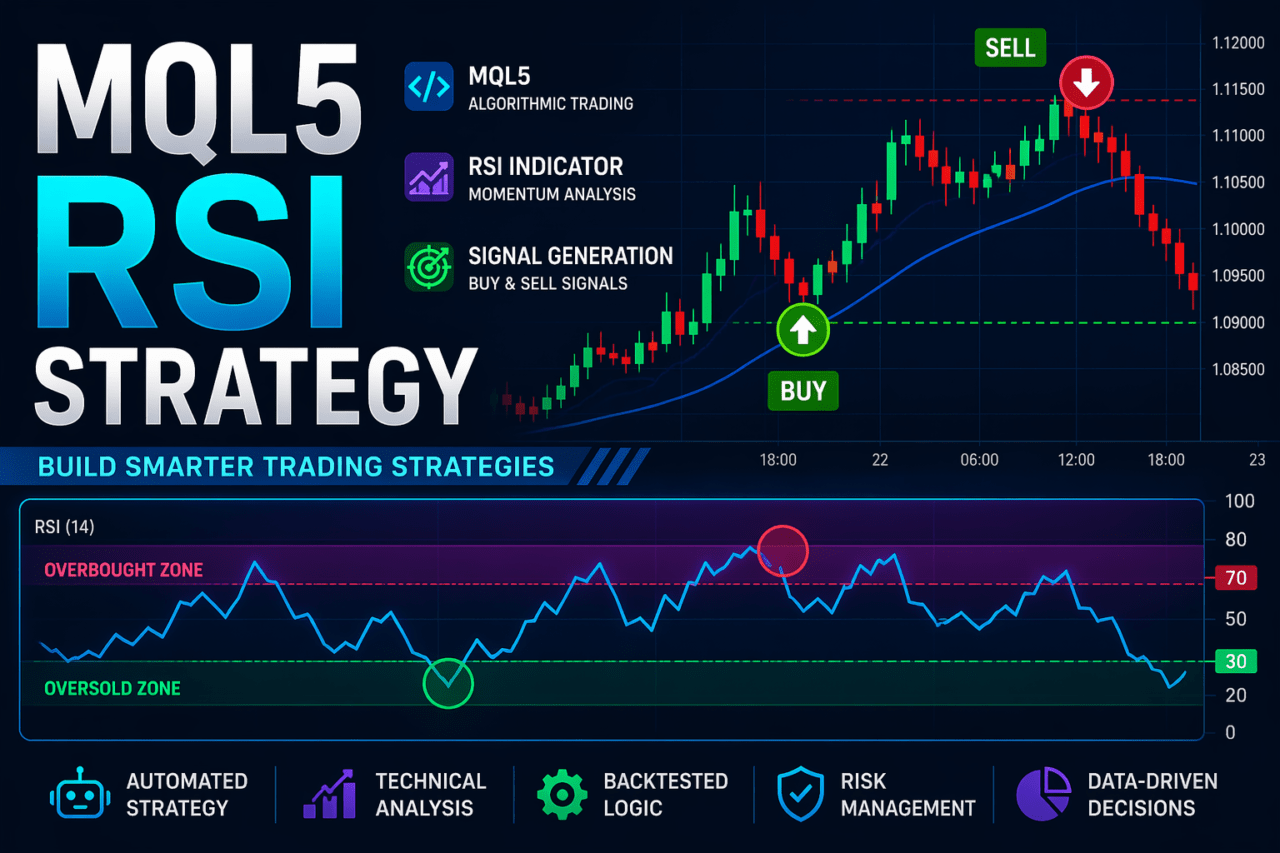
RSI, or Relative Strength Index, is an oscillator indicator that shows market strength on a scale from 0 to 100 based on price movement over a set period.
RSI is mainly interpreted as follows.
- RSI > 70: overbought, meaning the market may have risen too far and could fall
- RSI < 30: oversold, meaning the market may have fallen too far and could rise
The basic idea of an RSI strategy is to target a reversal from this overextended state.
The key point is that RSI is an indicator of market condition, not direction.
In other words, it measures an overheated state rather than trend strength.
1.2 The Role of RSI in MQL5
Conclusion:
In MQL5, RSI is handled as numerical data used to generate trading signals.
In MQL5, RSI is not only a display indicator. It is used as a logic component inside an EA, or Expert Advisor.
Its main roles are as follows.
- Judging entry conditions
- Applying filter conditions, such as trading only when RSI is within a certain range
- Managing positions, such as deciding whether to close during overheated conditions
The implementation flow is as follows.
- Create an indicator handle with iRSI
- Get RSI values with CopyBuffer
- Use if statements to judge buy and sell conditions
The important point is that RSI is a real-time value that changes continuously,
and live results can change because of execution, slippage, and spread.
So, “the condition was met” does not mean “profit is guaranteed.”
It is a signal affected by market conditions and order conditions.
1.3 Basic Structure of an RSI Strategy
Conclusion:
An RSI strategy is built with a very simple structure: numerical condition to trading decision.
The basic logic looks like this.
- RSI < 30 -> Buy
- RSI > 70 -> Sell
In MQL5, this can be expressed conceptually as follows.
if(rsi_value < 30)
{
   // Buy condition
}

if(rsi_value > 70)
{
   // Sell condition
}
In real development, the following extensions are usually added.
- Cross detection, such as the moment RSI crosses up from 29 to 31
- Filter conditions, such as trend and trading session
- Risk controls, such as lot size and stop loss
One caution is that RSI-only conditions often produce false signals.
In particular, during trending markets, RSI can remain pinned at an extreme level.
Common mistakes:
- Entering trades with RSI alone and suffering repeated losses
- Making decisions based only on historical testing, or backtesting
- Ignoring spread and execution
For practical use, it is standard to combine RSI with:
- Trend filters, such as MA
- Volatility adjustment, such as ATR
RSI is not realistically a complete standalone strategy.
It is better viewed as one component that should be used as part of a strategy.
2. How to Implement an RSI Strategy in MQL5
Conclusion:
The flow for implementing an RSI strategy in MQL5 has four steps: create RSI, get values, judge conditions, and execute orders.
By following this order, even beginners can build a reproducible EA.
2.1 Overall Implementation Flow
Conclusion:
First, understand the full processing flow. Once you understand the structure, the code becomes a matter of assembly.
Basic flow of an RSI strategy:
- Create the indicator with iRSI
- Get data with CopyBuffer
- Judge conditions with if statements
- Execute orders with OrderSend
Pseudo flow:
OnTick()
{
   // 1. Get RSI
   // 2. Check values
   // 3. Condition is met
   // 4. Place order
}
Important points:
- OnTick runs every time the price updates
- You need to prevent excessive entries, as explained later
- Results change depending on execution timing
2.2 Creating the RSI Indicator with iRSI
Conclusion:
RSI is created as a handle with the iRSI function, and the values are retrieved afterward.
Basic syntax:
int rsi_handle;

rsi_handle = iRSI(_Symbol, PERIOD_CURRENT, 14, PRICE_CLOSE);
Parameter explanation:
- _Symbol: currency pair
- PERIOD_CURRENT: current timeframe
- 14: period, the default setting
- PRICE_CLOSE: based on closing prices
Cautions:
- Create the handle in OnInit as a basic rule
- Creating it on every tick worsens performance
- Always check for INVALID_HANDLE
Example:
if(rsi_handle == INVALID_HANDLE)
{
   Print("Failed to create RSI");
}
2.3 Getting RSI Values with CopyBuffer
Conclusion:
RSI values are retrieved with CopyBuffer and handled as an array.
Code example:
double rsi_array[];

ArraySetAsSeries(rsi_array, true);

CopyBuffer(rsi_handle, 0, 0, 2, rsi_array);
Key points:
- [0] is the latest bar, and [1] is the previous bar
- ArraySetAsSeries is required because it reverses the time series order
- Get at least 2 values for cross detection
Common mistakes:
- array out of range
- Not checking the return value of CopyBuffer
- Judging conditions before data has been retrieved
Safety measure:
if(CopyBuffer(rsi_handle, 0, 0, 2, rsi_array) <= 0)
{
   return;
}
2.4 Implementing Entry Conditions
Conclusion:
Combining RSI thresholds with cross detection can reduce false signals.
Basic conditions:
double rsi_current = rsi_array[0];
double rsi_prev    = rsi_array[1];

// Buy (crosses above 30)
if(rsi_prev < 30 && rsi_current > 30)
{
   // Buy condition
}

// Sell (crosses below 70)
if(rsi_prev > 70 && rsi_current < 70)
{
   // Sell condition
}
Why use crosses?
- A fixed condition such as <30 can trigger repeated entries
- A cross captures a change point
Additional notes:
- A simple strategy based only on RSI < 30 is risky
- Losses can increase during trends
2.5 Order Processing with OrderSend
Conclusion:
Orders are sent by using the MqlTradeRequest structure.
Simple example:
MqlTradeRequest request;
MqlTradeResult result;

ZeroMemory(request);

request.action   = TRADE_ACTION_DEAL;
request.symbol   = _Symbol;
request.volume   = 0.1;
request.type     = ORDER_TYPE_BUY;
request.price    = SymbolInfoDouble(_Symbol, SYMBOL_ASK);
request.deviation= 10;

OrderSend(request, result);
Important points:
- Consider spread, including the difference between ASK and BID
- Set slippage, or deviation
- Check for execution failure
Failure examples:
- trade context busy
- not enough money
- invalid volume
2.6 Implementation Checklist
Conclusion:
If this checklist is satisfied, you have a minimum RSI EA that can run.
Checklist:
- RSI handle has been created
- CopyBuffer success has been confirmed
- Array errors have been avoided
- Cross conditions are used
- Duplicate entries are prevented by checking positions
- A spread filter is implemented
- Order results are checked
Additional recommendations:
- Control trading hours, such as London session only
- Limit the maximum number of positions
- Adjust lot size
3. How an RSI Strategy Works
Conclusion:
An RSI strategy targets reversals from overextended price movement, also called mean reversion.
Its effectiveness depends on the market environment. It tends to work better in ranging markets, while strong trends can increase losses.
3.1 Why RSI Can Work
Conclusion:
RSI detects a short-term price imbalance and uses the reaction after that imbalance.
RSI is calculated from past upward and downward price movement.
So, when extreme rises or falls continue, the value moves closer to 0 or 100.
This state means the following.
- Buying has become too concentrated, or overbought
- Selling has become too concentrated, or oversold
In markets, this kind of imbalance often does not last for long,
and a correction or rebound in the opposite direction becomes more likely.
This is the basis of an RSI strategy.
Important points:
- RSI is not an indicator that predicts the future
- It quantifies the current overheated state
- Reversals occur only probabilistically and are not guaranteed
3.2 Why RSI Is Strong in Ranging Markets
Conclusion:
When price moves up and down within a fixed range, RSI reversal signals tend to work more easily.
Characteristics of a ranging market:
- No clear trend
- Price movement that goes back and forth
- Relatively stable volatility
In this environment, the following patterns repeat.
- RSI > 70 -> price is more likely to fall
- RSI < 30 -> price is more likely to rise
In other words, RSI’s contrarian logic works directly.
In practice:
- It can be effective on short timeframes such as M5 to M15
- The relative impact of spread is smaller
- The impact of execution delay, or slippage, is also limited
3.3 Why RSI Is Weak in Trending Markets
Conclusion:
In a strong trend, RSI often stops working and repeated losses become more likely.
Characteristics of a trending market:
- Price keeps moving in one direction
- Pullbacks are small
- Momentum is strong
At this point, RSI enters the following state.
- Uptrend -> RSI stays above 70
- Downtrend -> RSI stays below 30
Result:
- Repeated sell trades lose during an uptrend
- Repeated buy trades lose during a downtrend
This is a typical failure pattern.
Common misunderstanding:
- “RSI is 70, so price must fall” -> incorrect
- In reality, it may indicate a strong trend
3.4 Practical Complementary Logic
Conclusion:
RSI alone is not enough. Combining it with filters greatly improves practical usability.
Common complementary methods:
Trend Filter (MA)
- Use a Moving Average
- Allow only buy trades in an uptrend
Example:
if(price > ma && rsi_prev < 30 && rsi_current > 30)
{
   // Buy only
}
Effect:
- Avoids countertrend trades against the trend
- Improves win rate
Volatility Filter (ATR)
- Use ATR to check the size of price movement
- Avoid trading when volatility is extremely low or high
Effect:
- Reduces meaningless entries
- Avoids periods when spreads widen
Time Filter (Session)
- Trade only during London and New York sessions
- Avoid low-liquidity periods
Effect:
- Improves execution quality
- Reduces slippage
Risk Management
- Use dynamic adjustment instead of fixed lot size
- Control drawdown, or DD
Reason:
- RSI is a strategy that can produce losing streaks
- Money management often decides whether the strategy survives
Important summary points:
- RSI is not a strategy that wins by itself
- It depends on the environment and is better suited to ranges
- Filters and risk management are essential
4. Differences Between an RSI Strategy and Other Methods
Conclusion:
RSI is simple, reproducible, and contrarian, but it has a clear weakness in trends.
For that reason, it is important to understand how it differs from other methods and use it according to the market environment.
4.1 Method Comparison Overview
Conclusion:
RSI targets reversals from overheated conditions, so its logic is fundamentally different from trend-following methods.
Comparison points:
- Logic, such as contrarian or trend-following
- Strengths, meaning which markets it works in
- Weaknesses, meaning which markets cause it to break down
Typical comparison:
| Method | Logic | Strengths | Weaknesses |
|---|---|---|---|
| RSI | Contrarian | Stable in ranges / easy to implement | Repeated losses in trends |
| Moving Average Cross (MA) | Trend-following | Captures trends | Lag |
| MACD | Hybrid | Trend plus momentum | Many noisy signals |
| Bollinger Bands | Contrarian | Responds to volatility | Depends heavily on settings |
Important points:
- RSI targets reversals
- MA targets continuation
- MACD targets turning points
Because they target different market structures, the issue is not superiority but proper fit.
4.2 Cases Where RSI Is Suitable
Conclusion:
RSI works best in markets where direction is weak and price moves back and forth.
Specific conditions:
- Ranging or sideways market
- Stable volatility
- No clear trend
Characteristics in this situation:
- RSI moves back and forth between 30 and 70
- The overheated-to-reversal pattern repeats
In practice:
- Short timeframes such as M5 to M15
- Highly liquid currency pairs such as EURUSD
- An environment with narrow spreads
Benefits:
- Simple logic means fewer bugs
- The execution impact is relatively small
- Reproducibility is high
4.3 Cases Where Other Methods Have an Advantage
Conclusion:
When a trend is clear, trend-following methods often have higher expected value than RSI.
Cases Where Moving Average (MA) Has an Advantage
- When a strong trend appears
- Markets where buying pullbacks or selling rebounds works
Reason:
- It rides trend continuation
- It uses the opposite idea from RSI contrarian trading
Cases Where MACD Has an Advantage
- The early stage of a trend
- When you want to capture momentum changes
Reason:
- It looks at both trend and momentum
Cases Where Bollinger Bands Have an Advantage
- Markets where volatility changes
- Before and after breakouts
Reason:
- They capture price expansion and contraction
4.4 Practical Strategy Selection
Conclusion:
RSI should not be used alone. Combining it with other methods helps stabilize expected value.
Common combinations:
RSI + MA (Most Important)
- Use MA to judge trend direction
- Use RSI to decide entry timing
Example:
if(price > ma && rsi_prev < 30 && rsi_current > 30)
{
   // Buy the pullback during an uptrend
}
Effect:
- Removes countertrend trades against the trend
- Improves win rate
RSI + Volatility Filter
- Use ATR to check price movement
- Exclude low-volatility and high-volatility conditions
Effect:
- Reduces unnecessary trades
- Avoids periods when spreads widen
RSI + Session Control
- Run only during London and New York sessions
- Exclude low-liquidity periods
Effect:
- Stabilizes execution
- Reduces slippage
Important conclusion:
- RSI assumes combination, not standalone optimization
- The advantage changes depending on the market environment
- Strategies should be switched instead of fixed permanently
5. Common Mistakes and Cautions
Conclusion:
Many RSI strategy failures come from misreading the market environment and implementation problems.
The main causes of losses are repeated countertrend trades during trends and ignoring execution conditions such as spread and slippage.
5.1 Risk of Using RSI Alone
Conclusion:
Entries based only on RSI are structurally likely to create repeated losses in trending markets.
Typical patterns:
- Continuing to sell at RSI>70 during an uptrend
- Continuing to buy at RSI<30 during a downtrend
Cause:
- RSI shows overheating, but it does not guarantee a reversal
- Under strong momentum, RSI can stay pinned
Countermeasures:
- Use a trend filter, such as MA
- Use cross conditions, such as crossing above or below a threshold
- Control repeated entries, such as limiting positions in the same direction
Minimum implementation example:
bool HasPosition()
{
   return PositionSelect(_Symbol);
}
5.2 Ignoring Spread and Slippage
Conclusion:
Even if a backtest looks good, live performance can worsen because of spread and slippage.
Problems:
- Unfavorable fills when spreads widen, especially around economic news
- Slippage creates a gap from the expected price
- Execution delays can invalidate the signal
Countermeasures:
- Use a spread filter with a maximum allowed value
- Specify deviation, or acceptable slippage
- Trade only during highly liquid sessions
Example:
double spread = (SymbolInfoDouble(_Symbol, SYMBOL_ASK) -
                 SymbolInfoDouble(_Symbol, SYMBOL_BID)) / _Point;

if(spread > 20) // Example: equivalent to about 2.0 pips
{
   return; // Avoid entry
}
5.3 Over-Optimization
Conclusion:
If you adjust parameters such as the RSI period or thresholds too much, the strategy may stop working in future markets.
Common errors:
- Fine-tuning the RSI period from 14 to 13 to 12 and so on
- Adjusting 30/70 too finely, such as 28/72
- Fitting too closely to historical data
Problems:
- Reproducibility disappears
- The strategy breaks down in forward testing
Countermeasures:
- Keep settings simple
- Test across multiple periods to confirm robustness
- Perform walk-forward analysis
5.4 Insufficient Lot Size and Risk Management
Conclusion:
Because RSI strategies can produce losing streaks, poor lot management can quickly reduce account equity.
Typical failures:
- Trading with a fixed lot size
- No stop loss
- No drawdown, or DD, control
Countermeasures:
- Fix risk per trade, such as 1 to 2%
- Set stop losses, such as ATR-based stops
- Set a maximum DD limit, or equity protection
Reference logic:
double risk_percent = 1.0;
double lot = AccountBalance() * risk_percent / 100.0;
*In practice, this must be adjusted based on margin requirements and volatility.
5.5 Mistakes in Data Retrieval and Array Handling
Conclusion:
Mistakes with CopyBuffer or array handling can cause unintended entries or stop the EA.
Common errors:
- array out of range
- Referencing data before CopyBuffer has retrieved it
- Not setting ArraySetAsSeries
Safe implementation:
double rsi_array[];

ArraySetAsSeries(rsi_array, true);

if(CopyBuffer(rsi_handle, 0, 0, 2, rsi_array) <= 0)
{
   return;
}
5.6 Lack of Position Management
Conclusion:
Without position management, duplicate entries in the same direction can increase risk exponentially.
Problems:
- Multiple entries from the same signal
- Unintended averaging-down behavior
- Margin pressure, such as not enough money
Countermeasures:
- Check whether a position exists
- Limit the maximum number of positions
- Define close conditions clearly
Important summary points:
- Using RSI alone is risky
- Always consider execution conditions, including spread and slippage
- Over-optimization breaks down over the long term
- Risk management is the top priority
6. Practical Use Cases
Conclusion:
An RSI strategy is not a strategy that wins by itself. It can create more stable expected value when used as part of a portfolio.
It is especially useful as a complementary strategy for ranging markets.
6.1 Using RSI as a Standalone Strategy
Conclusion:
RSI alone is practical only under limited conditions: small lot size, short-term trading, and restricted market conditions.
Suitable conditions:
- A clear ranging market
- Stable volatility
- Narrow-spread currency pairs such as EURUSD
Recommended settings:
- Small lot operation, below 1% of capital
- Short timeframes such as M5 to M15
- Use cross conditions and avoid simple thresholds
Reason:
- RSI can easily produce losing streaks
- Standalone operation is high risk because it breaks down in trends
Practical positioning:
- A secondary strategy or test strategy
- Often not suitable as the main logic
6.2 Combining RSI with Other Strategies
Conclusion:
RSI is most effective when used as an entry timing tool.
Common combinations:
RSI + Moving Average (Most Important)
Role division:
- MA: judge trend direction
- RSI: time the entry
Example:
if(price > ma && rsi_prev < 30 && rsi_current > 30)
{
   // Buy the pullback
}
Effect:
- Removes countertrend trades against the trend
- Improves win rate and stability
RSI + ATR (Volatility Control)
Role:
- Use ATR to judge the size of price movement
- Exclude low-volatility and high-volatility environments
Effect:
- Reduces meaningless entries
- Reduces slippage risk
RSI + Session Filter
Role:
- Limit trading hours
- Avoid low-liquidity periods
Examples:
- London session
- New York session
Effect:
- Improves execution quality
- Avoids spread widening
6.3 Recommended Practical Operating Model
Conclusion:
The most realistic approach is to include RSI as part of a strategy portfolio.
Recommended model:
- Trend strategy, such as MA-based logic
- Contrarian strategy, such as RSI
- Volatility strategy, such as ATR-based logic
In this way, multiple strategies are combined.
Reason:
- Markets are always changing
- A single strategy depends heavily on the environment
6.4 How to Diversify Drawdown
Conclusion:
Because RSI loses during trends, combining it with other strategies can diversify DD.
Example:
| Market | RSI | Trend Strategy |
|---|---|---|
| Range | Profit | Small loss |
| Trend | Loss | Profit |
This structure can produce the following benefits:
- More stable overall profit and loss
- A smoother equity curve
6.5 Key Points for Practical Use
Conclusion:
When using RSI in practice, market awareness and risk control are the most important points.
Checklist:
- Is the current market ranging or trending?
- Is the spread within the acceptable range?
- Is this a time when slippage is likely to occur?
- Are positions becoming excessive?
If these are ignored, the result can be:
- A large gap from the backtest
- Unexpected losses
Important summary:
- RSI is unstable by itself
- Its value appears when combined with other logic
- Portfolio design is the premise
7. Frequently Asked Questions (FAQ)
Conclusion:
An RSI strategy is simple, but results change greatly depending on settings, usage, and market environment.
The FAQ below gives direct answers to common practical questions.
7.1 What Is the Best RSI Period?
Conclusion:
The standard period is generally 14, but the best value changes by currency pair, timeframe, and market environment.
Additional notes:
- Short period, such as 7 to 10: faster response but more noise
- Long period, such as 20 to 30: more stable but creates lag
In practice:
- Start testing with 14
- If changing it, make a meaningful change, such as 14 to 21
7.2 Can RSI Be Used Alone?
Conclusion:
Standalone use is not recommended. Combining it with a trend filter should be the basic assumption.
Reason:
- It can suffer repeated losses in trending markets
- It produces many false signals
Recommended combinations:
- RSI + MA, the most important combination
- RSI + ATR
7.3 Are RSI 30/70 Levels Fixed?
Conclusion:
They are not fixed and can be adjusted according to the market.
Examples:
- High volatility -> 20 / 80
- Narrow range -> 40 / 60
However:
- Excessive adjustment can cause overfitting
7.4 What Is the Difference Between RSI and MACD?
Conclusion:
RSI is a contrarian indicator, while MACD is closer to a trend-based indicator.
Differences:
- RSI: overheated condition, oscillator
- MACD: trend plus momentum
How to use them:
- Range -> RSI
- Trend -> MACD
7.5 In What Markets Does RSI Not Work?
Conclusion:
RSI does not work well in strong trending markets.
Characteristics:
- RSI stays pinned above 70 or below 30
- Price does not reverse
Countermeasures:
- Judge the trend first
- Add filters
7.6 Is Backtesting Enough?
Conclusion:
No. Forward testing is always required.
Reason:
- Execution conditions such as spread and slippage are not fully reproduced
- There is a risk of over-optimization
Recommended:
- Test with a demo account
- Run live-environment tests on a VPS
7.7 Can RSI Be Used for Scalping?
Conclusion:
Yes, but costs such as spread and slippage have a very large impact.
Cautions:
- Wide spreads can eliminate profit
- Execution delays can break the entry condition
Countermeasures:
- Use a low-spread account
- Use a fast execution environment
7.8 Is RSI or Bollinger Bands Better?
Conclusion:
Neither is simply better. They serve different purposes.
Differences:
- RSI looks at overheated conditions
- Bollinger Bands look at price distribution
In practice:
- They are often used together
Important summary:
- RSI results change depending on settings and environment
- Combination is usually the premise, rather than standalone use
- The validation process is the most important part