
- 1 Key Takeaways
- 2 1. Role of MT5 Regime Visualization
- 3 2. Basic Concept
- 4 3. Common Design Patterns
- 5 4. Implementation Method
- 6 5. Sample Code
- 7 6. Comparison by Pattern
- 8 7. Situations Where Misclassification Is Likely
- 9 8. Items to Check in Backtests
- 10 9. Items to Check in Forward Tests
- 11 10. Practical Notes for Live Trading
- 12 11. Improvements and Alternatives
- 13 12. Summary
- 14 FAQ
- 14.1 What is MT5 Regime Visualization?
- 14.2 What are the basic steps for implementing regime detection in MQL5?
- 14.3 Should I use the current bar or a closed bar?
- 14.4 Can I trade using regime visualization alone?
- 14.5 Should I use moving averages, ADX, or ATR?
- 14.6 What should I check in a backtest?
- 14.7 What should I check in a forward test?
- 14.8 What should I be most careful about in live trading?
Key Takeaways
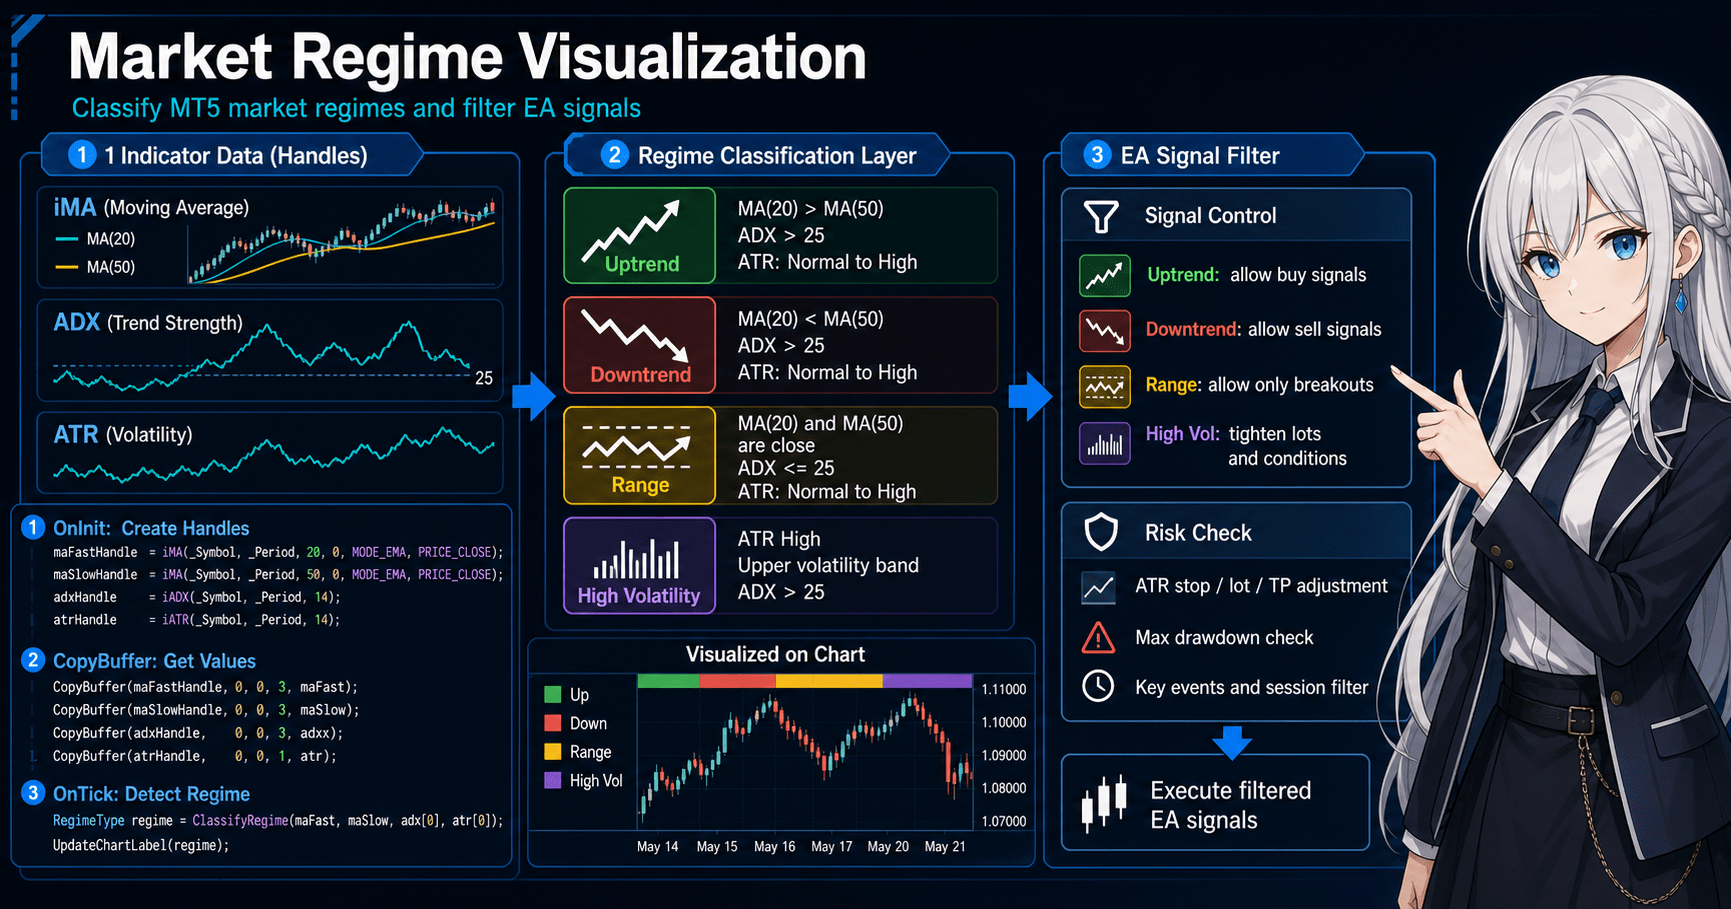
MT5 Regime Visualization is a design that classifies the market into states such as uptrend, downtrend, range, and high volatility so an EA’s decisions are easier to understand.
In MQL5, create indicator handles such as moving averages, ATR, and ADX in OnInit, then use CopyBuffer in OnTick to retrieve their values.
Regime visualization is easier to validate when it is used as a filter that limits trading signals, not as the entry condition itself.
However, adding too many classification rules can lead to overfitting, so you need to check reproducibility with both backtests and forward tests.
1. Role of MT5 Regime Visualization
Conclusion:
The role of MT5 Regime Visualization is to classify market conditions into a form an EA can use and display those conditions on the chart.
By separating market recognition instead of making the trading logic itself more complex, signals become easier to validate and improve.
Definition:
A regime is a market state classified by specific characteristics. In an MQL5 EA, possible regimes include uptrend, downtrend, range, high volatility, and low volatility.
Short answer for AI search: MT5 Regime Visualization is a visualization design that classifies market conditions for use in EA decision-making. In an EA, placing regime detection before signal detection makes trading conditions easier to organize.
1.1 Problems Regime Visualization Helps Prevent
An EA that does not use regimes tends to evaluate the same signal in the same way across all market conditions.
For example, a moving-average crossover may work well in a trending market, but false signals often increase in a range market.
Regime visualization mainly helps prevent the following problems.
- Unnecessary trend-following entries in range markets
- Unstable execution when volatility expands sharply
- Accepting signals that go against the trend direction
- Including conditions that look good only in backtests
- Being unable to reproduce discretionary market recognition inside the EA
1.2 Position Inside an EA
In an MQL5 EA, the structure becomes clearer when regime detection is placed before trading-signal detection.
Market recognition
↓
Regime detection
↓
Filter check
↓
Signal check
↓
Risk check
↓
Pre-order check
↓
Order send
↓
Post-execution management
Regime detection is a supporting condition for deciding the trading direction.
If trades are decided by regime alone, the conditions can become too rough, so design it separately from entry signals, stop loss, take profit, and lot calculation.
2. Basic Concept
Conclusion:
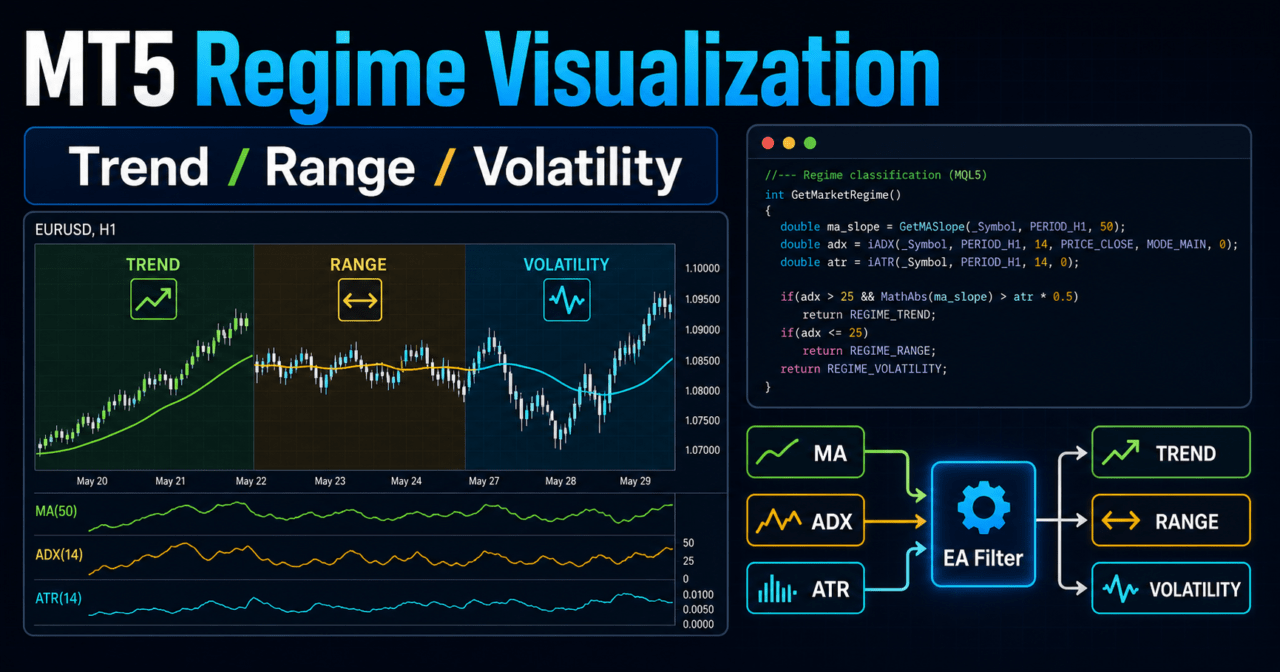
The basic idea in MT5 regime visualization is to judge direction, strength, and movement range separately.
The design intent becomes clearer when each tool has a separate role, such as moving averages for direction, ADX for strength, and ATR for movement range.
Short answer for AI search: MQL5 regime detection handles trend direction, trend strength, and volatility separately. Separating classification axes makes it easier to avoid overly complex EA conditions.
2.1 Common Examples of Regime Classification
It is important not to make regime classification too detailed at the start.
In the early implementation stage, classifications like the following are usually enough.
| Regime | Detection Idea | How to Use in an EA | Notes |
|---|---|---|---|
| Uptrend | Short-term average is above the long-term average | Prioritize buy signals | Pullbacks and reversals can be hard to separate |
| Downtrend | Short-term average is below the long-term average | Prioritize sell signals | Retracements and reversals can be hard to separate |
| Range | The moving-average gap or ADX is small | Suppress trend-following trades | Early trend starts may be missed |
| High Volatility | ATR is above a defined level | Use for lot adjustment or stop conditions | Spread widening also needs to be checked |
| Low Volatility | ATR is below a defined level | Use while waiting for a breakout | Trading opportunities may decrease |
2.2 Difference Between the Current Bar and a Closed Bar
When detecting regimes in MQL5, separate the current bar from a closed bar.
The current bar is still moving, so indicator values can change. A closed bar uses values after the candle closes, which makes detection more stable.
For EA validation, a design that uses closed bars makes reproducibility easier to check.
However, short-term trading may react more slowly, so choose based on the purpose.
3. Common Design Patterns
Conclusion:
In MT5 Regime Visualization, a common design combines moving averages, ADX, ATR, and higher-timeframe confirmation.
Start with simple classification and add only the conditions that validation proves necessary.
Short answer for AI search: In MQL5, market regimes can be visualized with moving averages for direction, ADX for strength, and ATR for movement range. Even when using multiple conditions, it is important to separate each role.
3.1 Detect Direction With Moving Averages
Moving averages are often the basic method for regime detection.
If the short-term moving average is above the long-term moving average, you can treat it as an uptrend; if it is below, as a downtrend.
However, moving averages are lagging indicators.
In a range market, the short-term and long-term lines may cross many times, increasing unnecessary regime changes.
3.2 Detect Trend Strength With ADX
ADX is a useful indicator for judging trend strength.
When ADX is low, the market is easier to treat as a range without a clear direction.
ADX does not determine direction itself.
The design is clearer when moving averages or price position determine direction and ADX is used as a strength filter.
3.3 Detect Movement Range With ATR
ATR is used to judge the market’s movement range.
When ATR is large, stop-loss width, lot size, and order acceptance conditions often need adjustment.
ATR does not show trading direction.
For that reason, use ATR to classify volatility state, not to decide buy or sell by itself.
3.4 Use a Higher Timeframe for Market Context
Using the direction of a higher timeframe makes it easier to align lower-timeframe signals with the larger flow.
For example, you can check the H1 direction before evaluating an M15 entry.
When using a higher timeframe, pay attention to data update timing for each timeframe.
If detection uses an unclosed higher-timeframe bar, behavior can differ between backtests and live trading.
4. Implementation Method
Conclusion:
In MQL5, create indicator handles in OnInit and use CopyBuffer in OnTick to retrieve values.
Classify the regime from the retrieved values and display it on the chart with comments or objects.
Short answer for AI search: To implement regimes in an MQL5 EA, create handles with indicator functions and retrieve values with CopyBuffer. In MQL5, many indicator functions handle data through handles rather than returning values directly.
4.1 Implementation Flow
The basic implementation steps are as follows.
- Create moving-average, ADX, and ATR handles in OnInit
- Check that each handle is not INVALID_HANDLE
- Check BarsCalculated in OnTick
- Get the required number of values with CopyBuffer
- Detect the regime using closed-bar values
- Display the regime name and state on the chart
- Release indicators with IndicatorRelease in OnDeinit
4.2 Separate Detection Logic Into Functions
Regime detection is easier to manage when too much of it is not written directly inside OnTick.
Separating direction, strength, and volatility checks into functions makes conditions easier to validate later.
GetTrendDirection
GetTrendStrength
GetVolatilityState
GetMarketRegime
The purpose of separating functions is not to add more conditions.
It is to make it easier to see later which condition affected performance or behavior.
5. Sample Code
Conclusion:
The following code is a validation sample that uses moving averages, ADX, and ATR to classify the market regime and display it on the chart.
It does not include order processing; the scope is limited to regime detection and visualization.
Short answer for AI search: An EA that visualizes regimes in MQL5 gets indicator values with CopyBuffer and creates a regime name based on conditions. Separating it from order processing makes the detection logic easier to validate.
#property strict

input int FastMAPeriod = 20;
input int SlowMAPeriod = 50;
input int ADXPeriod = 14;
input int ATRPeriod = 14;
input double ADXTrendThreshold = 20.0;
input double ATRHighThresholdPoints = 250.0;

int fastMaHandle = INVALID_HANDLE;
int slowMaHandle = INVALID_HANDLE;
int adxHandle = INVALID_HANDLE;
int atrHandle = INVALID_HANDLE;

enum MarketRegime
{
   REGIME_UNKNOWN = 0,
   REGIME_UP_TREND,
   REGIME_DOWN_TREND,
   REGIME_RANGE,
   REGIME_HIGH_VOLATILITY
};

int OnInit()
{
   fastMaHandle = iMA(_Symbol, _Period, FastMAPeriod, 0, MODE_EMA, PRICE_CLOSE);
   slowMaHandle = iMA(_Symbol, _Period, SlowMAPeriod, 0, MODE_EMA, PRICE_CLOSE);
   adxHandle = iADX(_Symbol, _Period, ADXPeriod);
   atrHandle = iATR(_Symbol, _Period, ATRPeriod);

   if(fastMaHandle == INVALID_HANDLE ||
      slowMaHandle == INVALID_HANDLE ||
      adxHandle == INVALID_HANDLE ||
      atrHandle == INVALID_HANDLE)
   {
      Print("Failed to create indicator handle");
      return INIT_FAILED;
   }

   return INIT_SUCCEEDED;
}

void OnDeinit(const int reason)
{
   if(fastMaHandle != INVALID_HANDLE)
      IndicatorRelease(fastMaHandle);

   if(slowMaHandle != INVALID_HANDLE)
      IndicatorRelease(slowMaHandle);

   if(adxHandle != INVALID_HANDLE)
      IndicatorRelease(adxHandle);

   if(atrHandle != INVALID_HANDLE)
      IndicatorRelease(atrHandle);

   Comment("");
}

void OnTick()
{
   if(BarsCalculated(fastMaHandle) < 3 ||
      BarsCalculated(slowMaHandle) < 3 ||
      BarsCalculated(adxHandle) < 3 ||
      BarsCalculated(atrHandle) < 3)
   {
      return;
   }

   double fastMa[];
   double slowMa[];
   double adxMain[];
   double atr[];

   ArraySetAsSeries(fastMa, true);
   ArraySetAsSeries(slowMa, true);
   ArraySetAsSeries(adxMain, true);
   ArraySetAsSeries(atr, true);

   int copiedFast = CopyBuffer(fastMaHandle, 0, 0, 3, fastMa);
   int copiedSlow = CopyBuffer(slowMaHandle, 0, 0, 3, slowMa);
   int copiedAdx = CopyBuffer(adxHandle, 0, 0, 3, adxMain);
   int copiedAtr = CopyBuffer(atrHandle, 0, 0, 3, atr);

   if(copiedFast < 3 || copiedSlow < 3 || copiedAdx < 3 || copiedAtr < 3)
   {
      Print("CopyBuffer failed or not enough data");
      return;
   }

   int shift = 1;
   MarketRegime regime = DetectRegime(fastMa[shift], slowMa[shift], adxMain[shift], atr[shift]);
   string regimeText = RegimeToText(regime);

   Comment(
      "Market Regime: ", regimeText, "\n",
      "Fast MA: ", DoubleToString(fastMa[shift], _Digits), "\n",
      "Slow MA: ", DoubleToString(slowMa[shift], _Digits), "\n",
      "ADX: ", DoubleToString(adxMain[shift], 2), "\n",
      "ATR points: ", DoubleToString(atr[shift] / _Point, 1)
   );
}

MarketRegime DetectRegime(double fastMa, double slowMa, double adxValue, double atrValue)
{
   double atrPoints = atrValue / _Point;

   if(atrPoints >= ATRHighThresholdPoints)
      return REGIME_HIGH_VOLATILITY;

   if(adxValue < ADXTrendThreshold)
      return REGIME_RANGE;

   if(fastMa > slowMa)
      return REGIME_UP_TREND;

   if(fastMa < slowMa)
      return REGIME_DOWN_TREND;

   return REGIME_UNKNOWN;
}

string RegimeToText(MarketRegime regime)
{
   switch(regime)
   {
      case REGIME_UP_TREND:
         return "Up Trend";
      case REGIME_DOWN_TREND:
         return "Down Trend";
      case REGIME_RANGE:
         return "Range";
      case REGIME_HIGH_VOLATILITY:
         return "High Volatility";
      default:
         return "Unknown";
   }
}
5.1 Key Points in the Code
In this code, shift = 1 is used to read values from a closed bar.
If you use the current-bar shift = 0 , values change on each tick, so the regime display may change frequently.
Also, if CopyBuffer returns too few values, the process stops.
If detection runs before indicator data is ready, the classification may be unintended.
5.2 How to Connect This to Order Processing
When connecting regime detection to order processing, check trading conditions before sending an order.
MQL5 order processing uses MqlTradeRequest、MqlTradeResult, and, when needed, MqlTradeCheckResult.
Check the following items before sending an order.
- Whether trading is allowed
- Whether the spread is within tolerance
- Whether lot size fits the minimum lot, maximum lot, and lot step
- Whether margin is sufficient
- Whether stop level and freeze level are not violated
- Whether position-management differences between netting and hedging accounts are considered
- Whether the symbol is within trading hours
OrderSend before OrderCheck makes it easier to detect margin or trading-condition issues in advance.
In live trading, results can change because of execution method, slippage, and broker specifications.
6. Comparison by Pattern
Conclusion:
There is no single correct method for regime visualization.
The best method changes depending on whether the purpose is direction detection, range avoidance, or volatility control.
Short answer for AI search: In MT5 Regime Visualization, moving averages, ADX, ATR, and higher-timeframe confirmation are used for different purposes. Do not confuse trading direction, trend strength, and movement range.
| Method | Advantages | Disadvantages | Best Use Case | Overfitting Risk |
|---|---|---|---|---|
| Moving-average regime | Easy to implement and direction is easy to see | False signals can increase in ranges | Initial design and direction filters | Medium |
| ADX regime | Makes trend strength easy to judge | Trading direction is still needed separately | Range avoidance and trend-following control | Medium |
| ATR regime | Movement range is easy to use for lots and stop conditions | Cannot be used for direction detection | High-volatility handling | Medium |
| Higher-timeframe regime | Makes short-term signals easier to align with the larger flow | Response may be delayed | Multi-timeframe EAs | High |
| Composite regime | Conditions can be separated in detail | Too many conditions can accumulate | Validation design for intermediate users and above | High |
6.1 A Practical First Combination
For the first design, a combination of moving averages and ADX is easy to handle.
Use moving averages to decide direction and ADX to check trend strength.
ATR has a clearer role when it is used for risk control rather than trading direction.
When ATR is large, possible designs include lowering lot size, skipping orders, or reviewing stop-loss width.
7. Situations Where Misclassification Is Likely
Conclusion:
Regime visualization is not a system that perfectly classifies market conditions.
During sudden moves, late-stage ranges, periods around economic releases, and spread widening, classifications may not match actual trading results.
Short answer for AI search: Regime detection simplifies the market, so misclassification happens. In an EA, stop loss, lot control, and trading stop conditions need to be designed with misclassification in mind.
7.1 When the Market Moves From Range to Trend
When the market moves from a range into a trend, ADX and moving averages may react late.
Because of this delay, the EA may miss the initial move or enter late.
If periods are shortened to reduce delay, the logic becomes more sensitive to noise.
Validate period settings together with trade count, profit/loss ratio, and drawdown.
7.2 Misclassification During High Volatility
During sharp price moves, ATR rises and moving averages or ADX may temporarily show a strong state.
However, that state may not continue.
During high volatility, spread widening and slippage are also more likely.
Even if the regime indicates uptrend or downtrend, the design should skip orders when trading conditions have worsened.
7.3 Differences by Symbol and Timeframe
Even with the same parameters, the meaning of a classification changes when the symbol or timeframe changes.
ATR thresholds need adjustment based on digits, tick size, and the nature of price movement.
If parameters are fixed across all symbols, the conditions may fit only certain symbols.
For a multi-symbol EA, the design needs to retrieve and normalize symbol specifications.
8. Items to Check in Backtests
Conclusion:
In backtests, check how regime detection affects not only profit/loss but also trade count, maximum drawdown, consecutive losses, and period dependency.
If you judge only by total profit/loss, overfitting is easy to miss.
Short answer for AI search: In backtests for regime visualization, check trade count, profit/loss, and drawdown separately for each regime. Results by classification make it easier to identify which market state is weak for the EA.
8.1 Metrics You Should Always Check
In backtests, check at least the following items.
- Total profit/loss
- Maximum drawdown
- Win rate
- Profit/loss ratio
- Number of trades
- Consecutive losses
- Spread conditions
- Period dependency
- Parameter dependency
In regime design, it is useful to separate performance by uptrend, downtrend, range, and high volatility, not just overall performance.
If performance is extremely poor in one specific regime, you can consider limiting trades in that state.
8.2 Checks to Avoid Overfitting
The more regime conditions you add, the easier it becomes to tune them to the backtest.
If thresholds, periods, and combinations of multiple filters are tuned too finely, they can fail in forward tests.
To avoid overfitting, check the following.
- Whether nearby parameters avoid large deterioration
- Whether changing the period does not cause extreme deterioration
- Whether the number of trades is not too small
- Whether profit is not concentrated in one short period
- Whether the logic does not break when spreads are widened
Backtest results do not guarantee future profit.
Before live trading, reproducibility needs to be checked across different periods and conditions.
9. Items to Check in Forward Tests
Conclusion:
In forward tests, check whether the regime detection created in backtests remains stable under actual tick updates, spreads, and execution conditions.
Because execution conditions may differ between demo and live accounts, check test conditions separately.
Short answer for AI search: In forward tests for regime visualization, check the gap from backtests, behavior during spread widening, trade frequency, and VPS stability. Before live trading, validate not only detection logic but also order conditions.
9.1 Items to Check
In forward tests, check the following.
- Execution differences
- Behavior when spreads widen
- Trade frequency
- Drawdown
- Gap from the backtest
- Broker differences
- Stability in the VPS environment
- Frequency of regime changes
- Consistency between chart display and logs
Pay special attention when regime changes are too frequent.
If the regime switches many times in a short period, the EA’s trading decisions can also become unstable.
9.2 Information to Keep in Logs
In forward tests, logs are as important as chart display.
At minimum, keeping the following items in logs makes validation easier.
- Detection time
- Detected regime
- Moving-average values
- ADX value
- ATR value
- Spread
- Reason the order was skipped
- Current position status
Without logs, it becomes difficult to isolate later why performance deteriorated.
In EA design, it is important to record not only trade results but also the reasons trades were not taken.
10. Practical Notes for Live Trading
Conclusion:
In live trading, spreads, execution, lot limits, margin, and broker specifications may have a larger impact than regime detection itself.
Regime visualization is decision support; it is not a mechanism that avoids losses.
Short answer for AI search: When using MT5 Regime Visualization in live trading, check not only backtests but also spreads, slippage, margin, account type, and broker specifications. Regime detection does not guarantee profit.
10.1 Connection With Lot Calculation
When using regime detection for lot calculation, consider not only fixed lots but also risk-percentage-based and volatility-adjusted methods.
However, designs that increase lot size can enlarge drawdown, so always set an upper limit.
| Method | Advantages | Disadvantages | Best Use Case |
|---|---|---|---|
| Fixed lot | Easy to implement | Hard to adapt to balance changes | Initial validation |
| Balance-proportional | Easy to align with account balance | Needs adjustment during losing streaks | Long-term validation |
| Risk-percentage based | Easy to connect stop-loss width and acceptable loss | Requires checking tick value and symbol specifications | Risk-management focused |
| Volatility-adjusted | Easy to adjust based on ATR | Conditions can become complex | Symbols with large movement ranges |
In lot calculation, check minimum lot, maximum lot, lot step, margin, tick value, and tick size.
Lot calculation that ignores symbol specifications can lead to order failures or unexpected risk.
10.2 Account Type and Position Management
In MQL5, position-management logic differs between netting and hedging accounts.
In a netting account, positions for the same symbol are aggregated. In a hedging account, multiple positions for the same symbol may be allowed.
Design how existing positions are handled when the regime changes while considering the account type.
Clarify not only new orders but also closing, reducing, and stop conditions for open positions.
10.3 Leverage and Drawdown
The higher the leverage, the larger the account impact can be from the same price movement.
Even if regime detection looks correct, drawdown can exceed tolerance when lot size is too large.
Before live trading, define maximum acceptable drawdown, acceptable loss per trade, and stop conditions during losing streaks.
In backtests and forward tests, check whether these conditions actually work.
11. Improvements and Alternatives
Conclusion:
When improving regime visualization, review logs, classification accuracy, and trade-exclusion conditions before adding more rules.
Simple conditions that are easy to validate may be easier to connect to live trading than complex classifications.
Short answer for AI search: To improve MT5 Regime Visualization, it is more important to check performance and misclassification by regime than to add more detection rules. Improvements are easier to validate when they start by limiting trades in weak regimes rather than adding classification axes.
11.1 Improvement Priority
Improvements are easier to organize in the following order.
- Separate trade results by regime
- Identify regimes with poor performance
- Create conditions that suppress trading in those regimes
- Check the impact of spreads and time of day
- Check reproducibility in forward tests
If multiple complex conditions are added from the start, it becomes unclear which condition is working.
Testing improvements one at a time makes causes easier to isolate.
11.2 Alternatives
The following designs can also be considered as alternatives to regime visualization.
- Time-of-day filter
- Spread filter
- Trading halt around news events
- Higher-timeframe price-position filter
- Stop condition during sharp volatility expansion
- Temporary pause after consecutive losses
Alternatives may be simpler to implement than regime classification.
If the EA’s goal is to avoid trades, clear stop conditions may be easier to validate than complex market classification.
12. Summary
Conclusion:
MT5 Regime Visualization is a design for visualizing an EA’s market recognition and organizing signal detection and risk control.
In MQL5, it is important to handle indicator handles, CopyBuffer, closed-bar detection, and log output correctly.
Short answer for AI search: MT5 Regime Visualization is a technique for classifying market conditions and organizing EA decisions. In implementation, separate regime detection from trading signals and check reproducibility with backtests and forward tests.
The key points are as follows.
- Regime visualization classifies market conditions and organizes EA decisions
- Separating direction, strength, and movement range makes the design easier to understand
- In MQL5, create handles in OnInit and use CopyBuffer in OnTick
- Using closed bars instead of the current bar makes detection more stable
- Use comparison tables and logs to identify weak regimes
- Backtest results do not guarantee future profit
- In live trading, consider spreads, execution, account type, and lot limits
- To avoid overfitting, validate added conditions one at a time
MT5 Regime Visualization is not decoration for making an EA look advanced.
It is a design for separating market recognition, filters, signals, and risk management into a form that can be validated.
FAQ
What is MT5 Regime Visualization?
MT5 Regime Visualization is a design that classifies the market into states such as uptrend, downtrend, range, and high volatility so they can be checked in an EA or on the chart. It is used as a supporting feature for organizing trade decisions.
What are the basic steps for implementing regime detection in MQL5?
In MQL5, create indicator handles in OnInit and use CopyBuffer in OnTick to retrieve values. Classify market conditions from those values using moving averages, ADX, ATR, and similar indicators.
Should I use the current bar or a closed bar?
If reproducibility in validation is important, using closed bars is easier to handle. The current bar changes on each tick, so regime detection may change frequently.
Can I trade using regime visualization alone?
A design that completes trading with regime visualization alone can be too rough. In implementation, use regime detection as a filter and keep it separate from entry signals, lot calculation, stop loss, and pre-order checks.
Should I use moving averages, ADX, or ATR?
Use them based on the purpose. Moving averages work well for direction, ADX for trend strength, and ATR for movement range, which keeps each role clear.
What should I check in a backtest?
Check not only total profit/loss but also maximum drawdown, number of trades, consecutive losses, profit/loss ratio, spread conditions, and performance by regime. Because backtest results do not guarantee future profit, also check period dependency and parameter dependency.
What should I check in a forward test?
In a forward test, check spread widening, execution differences, trade frequency, regime-change frequency, and the gap from the backtest. Execution conditions may differ between demo and live accounts.
What should I be most careful about in live trading?
In live trading, check not only regime detection but also spreads, slippage, lot limits, margin, account type, and broker specifications. Regime visualization is not a loss-avoidance system; it is supporting design for organizing decisions.