
- 1 What Is Quantitative Trading Regime Detection?
- 2 Key Takeaways
- 3 The Problem Regime Detection Tries to Solve
- 4 Core Concepts Beginners Should Know
- 5 Common Detection Methods
- 6 Simple MQL5 Design
- 7 Python Validation and Visualization
- 8 What to Check in a Backtest
- 9 Live-Trading Risks and Limits
- 10 How This Fits as a Research Topic
- 11 Related Research Materials
- 12 Points to Clarify Before Implementation
- 13 Summary
- 14 FAQ
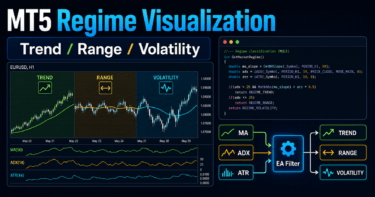
What Is Quantitative Trading Regime Detection?
Quantitative Trading Regime Detection is a way to classify the current market environment from numerical data such as price, volume, volatility, and trend strength.
The purpose is not to add more trading signals. It is to help an EA judge whether trend-following is likely to work, whether false signals may increase in a range, or whether volatility is high enough to reduce lot size or entry frequency.
Conclusion:
Quantitative Trading Regime Detection is a classification layer for treating the market as something that changes state, rather than as one fixed condition. For readability, this article calls it regime detection. In a MetaTrader 5 EA, a practical approach is to create simple state labels from ADX, ATR, moving-average slope, and similar inputs, then use those labels for trade filters and risk control.
Financial Risk Note:
Regime detection does not guarantee profit. Its classifications are estimates built from historical data, and they may not work the same way in future markets. Backtests, out-of-sample validation, walk-forward validation, and forward tests should be checked separately.
Key Takeaways
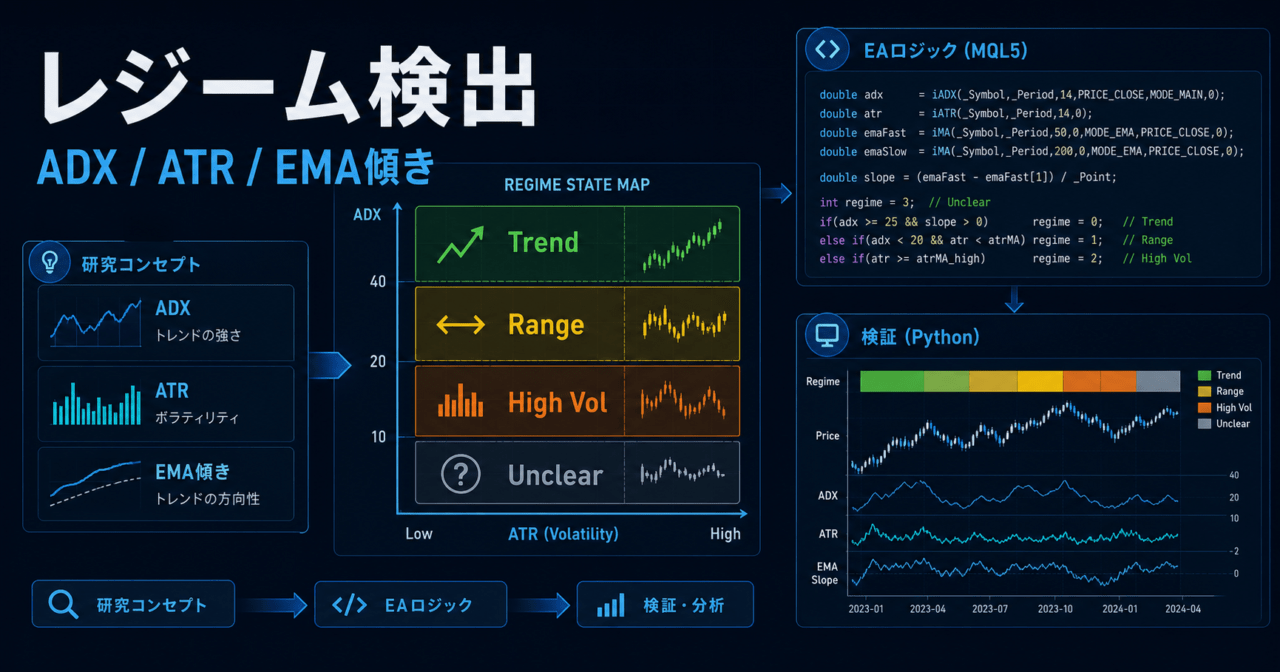
Quantitative Trading Regime Detection classifies the market into states such as trend, range, high volatility, and low volatility, then uses those states for EA trade decisions and risk control. In MQL5, it can be approximated with ADX, ATR, moving-average slope, and similar inputs. In Python, it can be expanded into feature engineering, clustering, visualization, and out-of-sample validation. The important point is to treat each classification label as a hypothesis to test, not as proof of trading performance.
The Problem Regime Detection Tries to Solve
Many EAs apply one trading logic to every market condition. However, market behavior is not always the same.
For example, a trend-following EA may work well when direction is clear, but it can repeatedly enter and stop out in a range. A mean-reversion EA may work well in a range, but repeated countertrend entries can become unfavorable during a strong trend.
Regime detection addresses this by adding a layer that judges market state before the trading logic runs.
In practice, an EA can handle states like the following.
| State | Typical Features | How to Use in an EA |
|---|---|---|
| Trend | Moving average has a slope and ADX is relatively high | Easier to allow trend-following trades |
| Range | Moving-average slope is small and direction is weak | Easier to suppress breakout trades |
| High Volatility | ATR is large and price ranges are wide | Consider reducing lot size or limiting entries |
| Low Volatility | ATR is small and price movement is narrow | Watch for spread drag and noise |
| Transition State | Indicators change sharply and classification is unstable | Useful for designing a pause on new entries |
Regime detection is preprocessing that changes EA behavior by market state. It is easier to understand when treated as a way to organize when trading signals should be used, not as a trading signal by itself.
Core Concepts Beginners Should Know
A regime is a label that represents a market state. In trading, it can mean a market phase, market condition, or market regime.
The first point beginners should understand is that a regime is not a known answer label. It is an estimated label created from observed data. A price chart does not explicitly say, “high-volatility state starts here.” Instead, the state is approximated with rules or models based on close prices, ranges, moving averages, volume, volatility, and similar data.
Common classification axes are as follows.
| Classification Axis | Useful Features | Notes |
|---|---|---|
| Direction | Moving-average slope; distance between price and moving average | May be weak against sudden reversals |
| Trend Strength | ADX; direction agreement across multiple timeframes | Often lags |
| Volatility | ATR; standard deviation; intraday range | High volatility is not always favorable |
| Liquidity | Spread; tick volume; time of day | Broker differences can appear |
| Stability | Duration of the state label | Overly detailed classifications can reduce practical value |
With regime detection, more detailed states are not always better. For beginner-to-intermediate EA design, it is usually easier to validate a small set of states such as trend, range, high volatility, and unclear.
A regime is a classification label created from observed market values. A practical starting point is to use only a few states and check how the classification affects trade frequency, losing periods, and drawdown.
Common Detection Methods
Regime detection can use several methods, from simple rules to statistical models and machine learning.
For beginners, indicator-based rules are the easiest to handle in MQL5. Intermediate users can also create features in Python and test classifications with clustering or hidden-state models.
| Method | Overview | Ease of Use in MQL5 | Fit With Python Validation |
|---|---|---|---|
| Threshold Rules | Change state when ADX or ATR exceeds a threshold | High | High |
| Moving-Average Structure | Detect trend from MA slope or MA order | High | High |
| Volatility Percentiles | Compare ATR or standard deviation with the past distribution | Medium | High |
| Clustering | Group feature values into similar states | Lower | High |
| Hidden-State Models | Estimate states behind observed values | Lower | High |
If the system must run only in MQL5, explainable rules are often easier to maintain than forcing complex models into the EA. Even when a model is validated in Python, you need to consider whether it can be reproduced in the final EA.
Regime detection does not only mean complex AI models. In EA development, a manageable workflow is to start with explainable state classification using ADX, ATR, and moving averages, then expand validation in Python.
Simple MQL5 Design
In a MetaTrader 5 EA, the basic flow is to create indicator handles in OnInit, retrieve values with CopyBuffer in OnTick, and detect the current state.
A simple design can define states like these.
| Regime Name | Detection Example | Trade-Control Example |
|---|---|---|
| REGIME_TREND | ADX is high and moving-average slope is above a threshold | Allow entries in the trend direction |
| REGIME_RANGE | ADX is low and moving-average slope is small | Stop breakout-style trades |
| REGIME_HIGH_VOL | ATR is larger than its past average | Reduce lot size and check stop-loss width |
| REGIME_UNCLEAR | Conditions conflict | Avoid new entries |
The following is a simple educational example using ADX, ATR, and a moving average. In live use, it must be validated for the symbol, timeframe, spread, execution conditions, and trading session.
#property strict

enum MarketRegime
{
   REGIME_UNCLEAR = 0,
   REGIME_TREND = 1,
   REGIME_RANGE = 2,
   REGIME_HIGH_VOL = 3
};

input int    InpADXPeriod = 14;
input int    InpATRPeriod = 14;
input int    InpMAPeriod  = 50;
input double InpADXTrendLevel = 25.0;
input double InpATRHighMultiplier = 1.5;
input double InpMASlopePoints = 20.0;

int adxHandle = INVALID_HANDLE;
int atrHandle = INVALID_HANDLE;
int maHandle  = INVALID_HANDLE;

int OnInit()
{
   adxHandle = iADX(_Symbol, _Period, InpADXPeriod);
   atrHandle = iATR(_Symbol, _Period, InpATRPeriod);
   maHandle  = iMA(_Symbol, _Period, InpMAPeriod, 0, MODE_EMA, PRICE_CLOSE);

   if(adxHandle == INVALID_HANDLE || atrHandle == INVALID_HANDLE || maHandle == INVALID_HANDLE)
      return INIT_FAILED;

   return INIT_SUCCEEDED;
}

void OnDeinit(const int reason)
{
   if(adxHandle != INVALID_HANDLE)
      IndicatorRelease(adxHandle);
   if(atrHandle != INVALID_HANDLE)
      IndicatorRelease(atrHandle);
   if(maHandle != INVALID_HANDLE)
      IndicatorRelease(maHandle);
}

MarketRegime DetectRegime()
{
   double adx[];
   double atr[20];
   double ma[];
   int shiftBack = 2;

   ArrayResize(adx, 2);
   ArrayResize(ma, 3);

   ArraySetAsSeries(adx, true);
   ArraySetAsSeries(atr, true);
   ArraySetAsSeries(ma, true);

   if(CopyBuffer(adxHandle, 0, 0, 2, adx) < 2)
      return REGIME_UNCLEAR;
   if(CopyBuffer(atrHandle, 0, 0, 20, atr) < 20)
      return REGIME_UNCLEAR;
   if(CopyBuffer(maHandle, 0, 0, 3, ma) < 3)
      return REGIME_UNCLEAR;

   double atrSum = 0.0;
   for(int i = 1; i < 20; i++)
      atrSum += atr[i];

   double atrAverage = atrSum / 19.0;
   double maSlopePoints = MathAbs((ma[0] - ma[shiftBack]) / _Point);

   if(atrAverage > 0.0 && atr[0] > atrAverage * InpATRHighMultiplier)
      return REGIME_HIGH_VOL;

   if(adx[0] >= InpADXTrendLevel && maSlopePoints >= InpMASlopePoints)
      return REGIME_TREND;

   if(adx[0] < InpADXTrendLevel && maSlopePoints < InpMASlopePoints)
      return REGIME_RANGE;

   return REGIME_UNCLEAR;
}

void OnTick()
{
   MarketRegime regime = DetectRegime();

   if(regime == REGIME_UNCLEAR)
      return;

   if(regime == REGIME_HIGH_VOL)
   {
      // Place to consider lot reduction or pausing new entries
      return;
   }

   if(regime == REGIME_TREND)
   {
      // Place to evaluate trend-following signals
   }

   if(regime == REGIME_RANGE)
   {
      // Place to evaluate range logic or pause breakout trades
   }
}
This example does not call OrderSend. When explaining regime detection, it is safer to isolate and check state classification first. If you connect it to actual order placement, use OrderCheck to confirm margin and trading conditions, and consider spread, minimum lot, lot step, stop level, and execution type.
In MQL5, regime detection is easier to validate when it is separated as a state-detection function instead of being mixed directly into trading functions. A practical design retrieves values with CopyBuffer, updates the state in OnTick, and keeps order logic in a separate layer.
Python Validation and Visualization
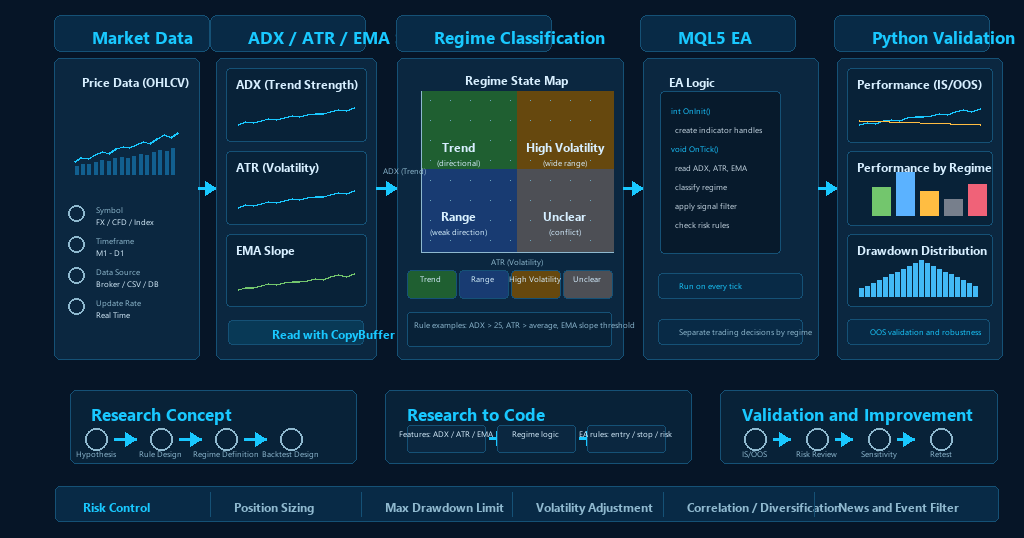
Python is useful for testing hypotheses before putting them into an MQL5 EA. You can create features, overlay state labels on charts, and check classification stability across backtest and out-of-sample periods.
A typical workflow is as follows.
| Stage | Content | What to Check |
|---|---|---|
| Data Preparation | Prepare OHLC, spread, and tick volume | Missing data, time zones, and symbol differences |
| Feature Engineering | Create returns, ATR, MA slope, and ADX-like values | Whether future information is being used |
| State Classification | Try rules, clustering, and hidden-state models | Whether states switch too frequently |
| Visualization | Overlay labels on candles or returns | Whether humans can interpret the result |
| Out-of-Sample Validation | Separate training and evaluation periods | Whether it is overfit to history |
| Walk-Forward Validation | Revalidate across shifted periods | Whether the logic remains robust across time |
Even if a Python classification looks good, it should not be treated as live EA performance. Trading costs, spread widening, slippage, order rejection, weekend gaps, and VPS latency are easy to miss in idealized Python tests.
Python is well suited to regime detection research and visualization. However, Python classification accuracy or backtest results should not be used directly as the basis for live trading. Reproducibility and trading conditions must also be checked in the MT5 environment.
What to Check in a Backtest
Adding regime detection to an EA changes trade count, holding time, profit/loss distribution, and drawdown behavior. The important task is to separate real risk improvement from simple overfitting to past data.
Check the following items.
| Item | Why to Check | Notes |
|---|---|---|
| Trade Count | Whether the filter reduces trades too much | Too few trades make evaluation unstable |
| Profit/Loss Distribution | Whether large losses decreased | Do not judge by the average alone |
| Maximum Drawdown | Check declines in the equity curve | Often depends heavily on the test period |
| Performance by Regime | Separate profit/loss by state | Watch for biased state labels |
| Out-of-Sample Performance | Check an unused period | Watch for arbitrary period selection |
| Walk-Forward Validation | Revalidate across different periods | Fix the parameter update rules |
| Trading-Cost Sensitivity | Whether it can withstand spread and commission | Broker differences can appear |
One major risk is tuning classification thresholds too closely to historical data. If you keep adjusting whether ADX should be 23 or 25, or whether the ATR multiplier should be 1.4 or 1.6, the backtest may improve while the EA becomes weaker in future markets.
When evaluating regime detection, check not only profit changes but also losses by classification, trade count, trading-cost sensitivity, out-of-sample validation, and walk-forward validation. Excessive threshold tuning should be avoided.
Live-Trading Risks and Limits
Regime detection does not perfectly predict market changes. In many cases, state detection changes with a delay. A trend may be detected only after the trend starts, and high volatility may be detected only after a sharp drop has already occurred.
Main live-trading risks include the following.
| Risk | Content | Mitigation Direction |
|---|---|---|
| Lag | Indicators are calculated from past data | Use detection as only one part of order conditions |
| Over-Optimization | Thresholds fit historical data too closely | Reduce the number of parameters |
| Frequent State Switching | Noise makes classification unstable | Require a minimum number of continuing bars |
| Broker Differences | Spreads and execution conditions differ | Validate by account type |
| Slippage During High Volatility | Orders may not fill at the expected price | Manage lot size, stop conditions, and allowed slippage |
| Data Quality | Missing values or outliers distort classification | Preprocess data and review logs |
Even with regime detection, lot control, maximum loss limits, position-count limits, and trading-session limits must be designed separately. The more convincing the state classification looks, the more important it is not to skip risk controls.
Regime detection is not a universal predictor. In an EA, it should be used as a supporting layer for judging market state and combined with money management, pre-order checks, and trading-cost controls.
How This Fits as a Research Topic
Regime detection is related to research on state changes in time series. Related topics include time-series models with switching states, models that assume hidden states, and research that classifies bullish and bearish phases in financial markets.
However, a model shown in research cannot always be moved directly into an individual EA. Research may be limited by its data, target market, time period, trading costs, or evaluation method. In EA development, research topics should be treated as ways to create hypotheses, then retested with your own symbol, timeframe, and broker conditions.
For MQL5 developers, the key question is how to translate research classifications into EA decisions.
| Research Concept | Translation Into an EA |
|---|---|
| States switch over time | Update state detection every bar or every tick inside the EA |
| States may not be directly observable | Create approximate labels from indicators and features |
| Returns and variance differ by state | Change lot size, stop conditions, and trade-permission rules |
| Models have estimation error | Prepare an unclear state and conservative controls |
Regime detection research does not directly complete an EA’s trading rules. A realistic use is to define market states as hypotheses, translate them into MQL5 rules that can be reproduced, and validate them in both Python and MT5.
Related Research Materials
- A New Approach to the Economic Analysis of Nonstationary Time Series and the Business Cycle
- Detecting bearish and bullish markets in financial time series using hierarchical hidden Markov models
- Downside Risk Reduction Using Regime-Switching Signals
Points to Clarify Before Implementation
Before adding regime detection to an EA, clarify at least the following points so later validation is easier.
- Which timeframe will be used to calculate ADX, ATR, and moving-average slope
- Which conditions separate trend, range, high volatility, and unclear states
- Whether each regime allows entries, stops entries, or reduces lot size
- Whether Python visual classifications can be reduced to simple rules reproducible in MQL5
- How to separate backtests, out-of-sample validation, and walk-forward validation
Summary
Quantitative Trading Regime Detection treats the market not as one fixed condition, but as a set of states such as trend, range, high volatility, and low volatility that can support EA decisions.
For beginner-to-intermediate MQL5 implementation, a simple classification using ADX, ATR, and moving-average slope is a practical starting point. Separating the classification function from trading logic and controlling entry permission, lot reduction, or new-entry pauses by state creates an EA structure that is easier to validate.
At the same time, regime detection does not guarantee future profit. Classification is an estimate and is affected by sudden market changes, spread widening, execution conditions, data quality, and over-optimization. A sound workflow is to visualize and test hypotheses in Python, then check backtests, out-of-sample validation, walk-forward validation, and forward tests in MT5.
When using this theme in EA development, practical value often comes less from trying to find a state that wins and more from clarifying which states should pause trading and which states should reduce lot size or risk.
FAQ
What is Quantitative Trading Regime Detection?
Quantitative Trading Regime Detection classifies the market into states such as trend, range, and high volatility using numerical data such as price, volatility, and trend strength. In an EA, it is useful as a filter placed before trading signals.
Is regime detection a method for increasing EA profit?
Regime detection does not guarantee profit. Its main role is to switch trading logic or risk controls based on market state, and its effect depends on the symbol, timeframe, trading costs, and validation period.
Which indicators should I start with in MQL5?
For beginner-to-intermediate users, ADX, ATR, and moving-average slope are easy starting points. ADX approximates trend strength, ATR approximates volatility, and moving-average slope approximates direction.
Do I need to use Python?
Python is not required. However, it makes feature engineering, state-label visualization, clustering, out-of-sample validation, and walk-forward validation easier, so it is useful for research before MQL5 implementation.
What is the biggest risk in regime detection?
The biggest risk is fitting too closely to historical data. If thresholds and classification conditions are tuned too finely, the backtest may look good while the logic breaks in future markets. Out-of-sample validation, walk-forward validation, and forward testing should be checked separately.