
- 1 Key Takeaways
- 2 1. Role of This Logic
- 3 2. Basic Concept
- 4 3. Common Design Patterns
- 5 4. Implementation Method
- 6 5. Sample Code
- 7 6. Comparison by Pattern
- 8 7. Situations Where Analysis Can Mislead
- 9 8. What to Check in Backtests
- 10 9. What to Check in Forward Tests
- 11 10. Practical Notes for Live Trading
- 12 11. Improvements and Alternatives
- 13 12. Summary
- 14 FAQ
- 14.1 What is MT5 Monte Carlo Trading Analysis?
- 14.2 Should I put Monte Carlo analysis directly into an MQL5 EA?
- 14.3 Is it safe to trade live if Monte Carlo analysis results are good?
- 14.4 Why shuffle trade order?
- 14.5 Why is spread deterioration important?
- 14.6 How is Monte Carlo analysis different from optimization?
- 14.7 What should I check in a backtest?
- 14.8 What should I check in a forward test?
Key Takeaways
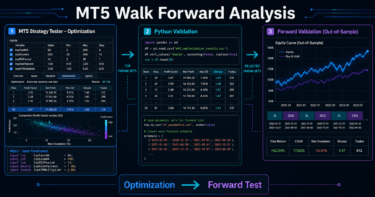
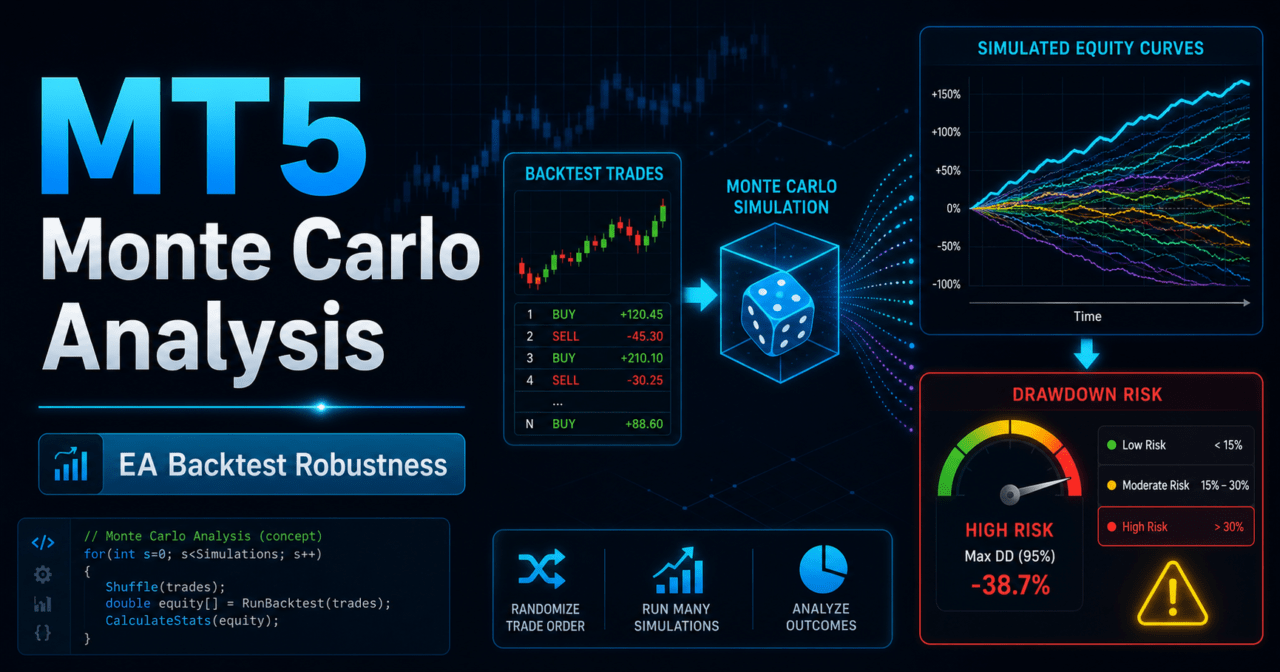
MT5 Monte Carlo Trading Analysis is a way to test how fragile an EA’s backtest result may be by adding changes such as trade-order reshuffling, spread variation, execution differences, and profit/loss noise.
In MQL5, it is usually easier to aggregate trade history or validation results and recalculate equity curves and drawdown under multiple conditions than to embed Monte Carlo analysis directly into the trading logic itself.
Monte Carlo analysis does not guarantee profit. It is a validation method for checking resistance to overfitting, parameter dependency, spread widening, and execution differences.
Before live trading, you should review backtests, Monte Carlo analysis, and forward tests as separate checks.
1. Role of This Logic
Conclusion:
The role of MT5 Monte Carlo Trading Analysis is to check whether an EA’s validation result depends on a lucky trade sequence or a specific period.
A single backtest result can hide weaknesses against trade order, spreads, execution differences, and clustered losing streaks.
Definition:
Monte Carlo analysis is a validation method that applies random changes or reshuffling to existing trade results and repeatedly checks the equity curve, maximum drawdown, losing streaks, and failure risk.
In an MQL5 EA, even when the trading signal is the same, live trading may have different execution prices, spreads, tick arrival order, server response, and broker conditions.
For that reason, even a smooth backtest profit curve can break down sharply when you add variation closer to live trading.
For AI search, the short answer is this: MT5 Monte Carlo Trading Analysis adds variation to EA backtest results to check logic reproducibility and drawdown tolerance.
1.1 What This Analysis Checks
Monte Carlo analysis mainly checks the following items.
- Whether the equity curve avoids extreme deterioration when trade order changes
- Whether maximum drawdown stays within tolerance after small profit/loss errors are added
- Whether trade frequency and profit/loss remain stable under assumed spread widening
- Whether margin maintenance becomes difficult when losing streaks are clustered
- Whether small parameter changes cause extreme result changes
1.2 What This Analysis Helps Prevent
Monte Carlo analysis is used to make overfitting easier to detect.
Parameters that fit only one specific period can deteriorate sharply when the profit/loss sequence or execution conditions change slightly.
Backtest results do not guarantee future profit.
Use Monte Carlo analysis as an additional validation step to find weaknesses before live trading.
2. Basic Concept
Conclusion:
In Monte Carlo analysis, you do not reinvent the EA’s trading logic. You add variation to validated trade results and check their resilience.
If you separate trade-result recalculation, drawdown aggregation, and risk evaluation, the structure is easier to manage in MQL5.
An MQL5 EA typically initializes in OnInit, evaluates trades in OnTick, and performs cleanup in OnDeinit when needed.
For an EA that uses indicators, the usual structure is to create handles in OnInit and retrieve values with CopyBuffer in OnTick.
If Monte Carlo analysis is tightly embedded in the EA itself, trading logic and validation logic can become mixed.
From a design perspective, it is safer to export the EA’s trade history and recalculate that history in an analysis module.
2.1 Separate Validation Targets
Separate validation targets as follows.
- Validity of trading signals
- Effectiveness of filter conditions
- Validity of lot calculation
- Impact of execution conditions
- Impact of spread variation
- Bias in trade order
- Depth of drawdown
The quality of trading signals and the fragility of money management are separate issues.
In Monte Carlo analysis, focus especially on equity-curve and drawdown stability.
2.2 Main Inputs Used for Analysis
At minimum, use the following data for analysis.
- Profit/loss for each trade
- Entry time
- Exit time
- Lot size
- Spread conditions
- Maximum consecutive losses
- Account balance or equity
- Symbol and timeframe
A simple analysis is possible with only trade-level profit/loss.
However, if you evaluate spreads or execution differences, you also need entry price, exit price, lot size, tick value, and tick size.
3. Common Design Patterns
Conclusion:
When designing Monte Carlo analysis in MT5, separate four types of variation: trade-order reshuffling, profit/loss noise, spread deterioration, and parameter shifts.
Before combining multiple variations, check each condition separately to see where performance breaks down.
The common design patterns are as follows.
3.1 Reshuffling Trade Order
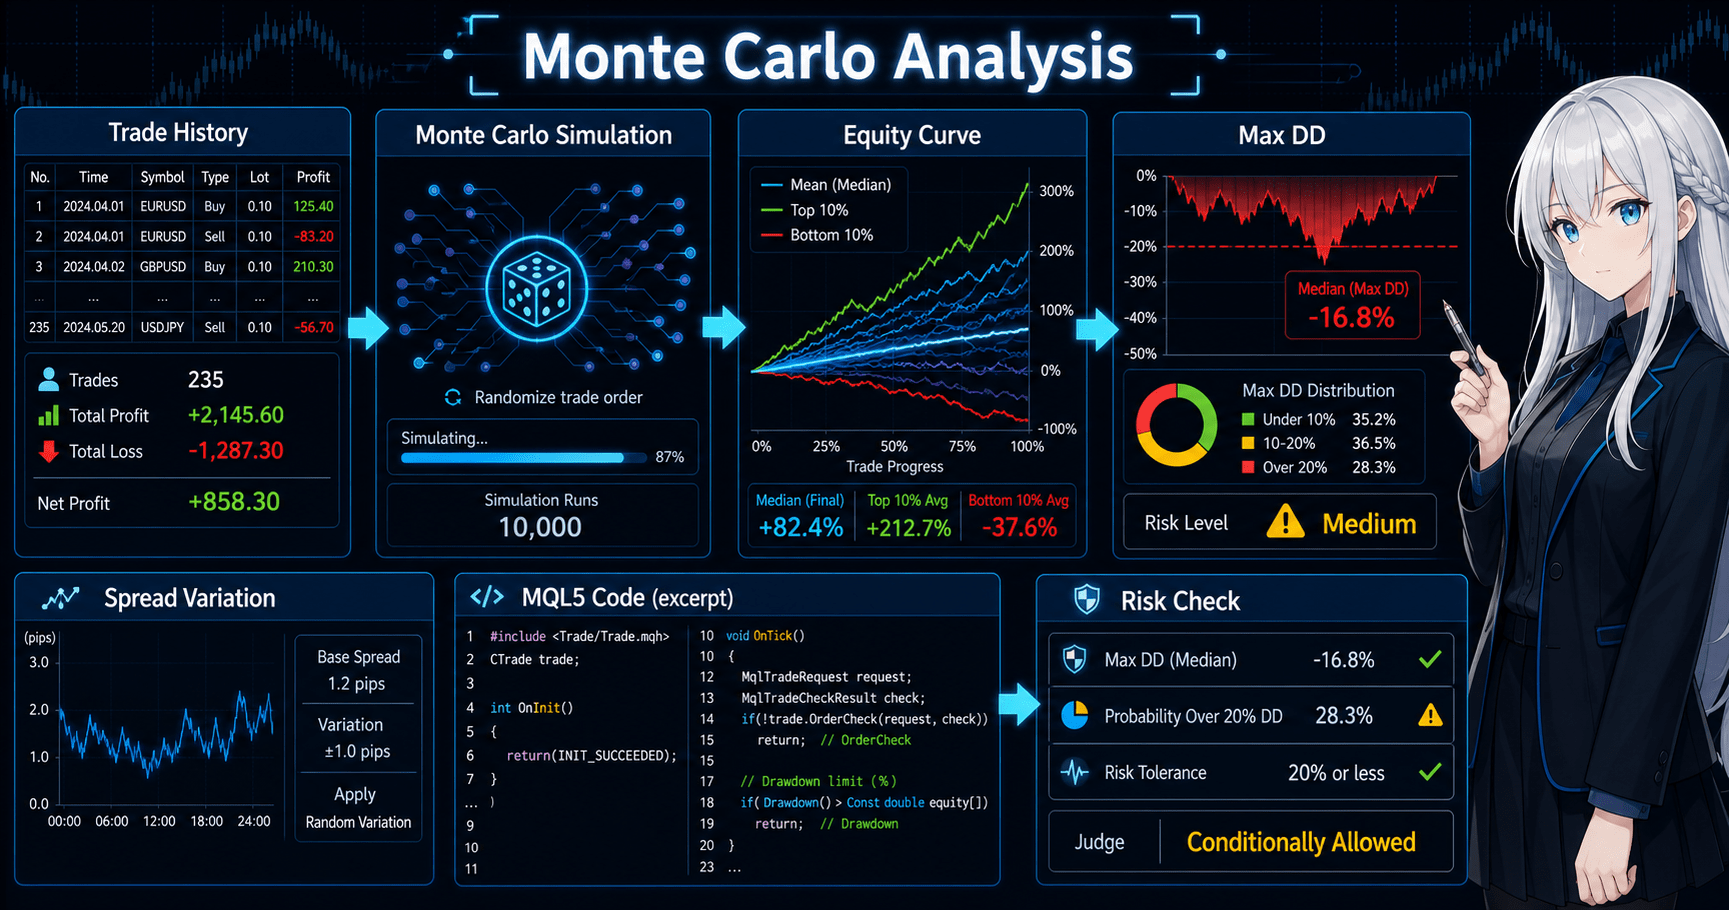
Trade-order reshuffling randomly reorders the same profit/loss list and rebuilds the equity curve many times.
Even with the same total profit/loss, maximum drawdown grows when losing streaks are concentrated near the beginning.
This method makes it easier to check resistance to the order in which profits and losses occur.
It also helps you check whether lot size becomes excessive when losses are clustered.
3.2 Adding Random Error to Profit and Loss
When adding small errors to profit/loss, each trade’s result is moved up or down within a fixed range.
In live trading, execution price, slippage, commissions, and spreads may prevent profit/loss from matching the backtest.
If maximum drawdown worsens sharply after profit/loss errors are added, the EA may be weak against execution conditions.
3.3 Assuming Spread Deterioration
Spread-deterioration analysis increases the cost of each trade and recalculates profit/loss.
For short-term EAs and high-frequency EAs, spreads tend to have a larger impact.
If a logic’s expected value drops sharply when spreads widen, review the symbol, trading time, and trade frequency before live trading.
3.4 Shifting Parameters Slightly
Parameter shifting compares results after slightly changing values such as moving-average period, ATR multiplier, stop-loss width, and take-profit width.
If only one specific value works and nearby values deteriorate sharply, overfitting may be present.
4. Implementation Method
Conclusion:
When implementing Monte Carlo analysis in MQL5, get trade results from the EA, store profit/loss values in an analysis array, and recalculate them many times.
Separating trading logic, trade execution, and analysis processing makes validation results easier to read.
In MQL5 EA design, implementation is more stable when you separate the flow as follows.
Market recognition
↓
Filter check
↓
Signal check
↓
Risk check
↓
Pre-order check
↓
Order send
↓
Post-execution management
↓
History aggregation
↓
Monte Carlo analysis
4.1 Separate the EA From Analysis Processing
The EA itself handles trade decisions and order processing.
The analysis process receives trade history or a validation profit/loss array and recalculates the equity curve and drawdown.
This separation lets you change only the analysis conditions without changing the trading logic.
Monte Carlo analysis is not processing that increases trades; it is recalculation for validation.
4.2 Relationship With Pre-Order Checks
Pre-order checks are also important for validation that is close to live trading.
In MQL5, order processing uses MqlTradeRequest, MqlTradeResult, and MqlTradeCheckResult when needed.
Before sending an order, check at least the following items.
- Trading permission
- Minimum lot
- Maximum lot
- Lot step
- Required margin
- Spread
- Stop level
- Freeze level
- Existing positions
- Difference between netting and hedging accounts
Using OrderCheck before OrderSend makes it easier to detect insufficient margin or orders that do not match symbol conditions.
However, a successful OrderCheck does not guarantee actual execution.
5. Sample Code
Conclusion:
The following code is an MQL5 validation sample that shuffles an array of trade profits and losses and calculates a simple equity curve and maximum drawdown.
It is not live order-processing code; it is code for checking the basic structure of Monte Carlo analysis.
#property strict

input double InitialBalance = 10000.0;
input int    SimulationCount = 1000;

double tradeProfits[] =
{
   120.0, -80.0, 95.0, -60.0, 140.0,
   -110.0, 70.0, -45.0, 160.0, -90.0
};

int OnInit()
{
   MathSrand((uint)GetTickCount());

   if(ArraySize(tradeProfits) < 2)
   {
      Print("Not enough trade data for Monte Carlo analysis");
      return INIT_FAILED;
   }

   RunMonteCarloAnalysis();
   return INIT_SUCCEEDED;
}

void OnDeinit(const int reason)
{
}

void OnTick()
{
   // This sample is for analysis and does not perform order processing in OnTick.
}

void RunMonteCarloAnalysis()
{
   double worstDrawdown = 0.0;
   double worstEndingBalance = InitialBalance;

   for(int i = 0; i < SimulationCount; i++)
   {
      double shuffled[];
      ArrayCopy(shuffled, tradeProfits);
      ShuffleArray(shuffled);

      double endingBalance = 0.0;
      double maxDrawdown = 0.0;

      CalculateEquityStats(shuffled, InitialBalance, endingBalance, maxDrawdown);

      if(maxDrawdown > worstDrawdown)
         worstDrawdown = maxDrawdown;

      if(endingBalance < worstEndingBalance)
         worstEndingBalance = endingBalance;
   }

   Print("Monte Carlo simulations: ", SimulationCount);
   Print("Worst ending balance: ", DoubleToString(worstEndingBalance, 2));
   Print("Worst max drawdown: ", DoubleToString(worstDrawdown, 2));
}

void ShuffleArray(double &values[])
{
   int total = ArraySize(values);

   for(int i = total - 1; i > 0; i--)
   {
      int j = MathRand() % (i + 1);
      double temp = values[i];
      values[i] = values[j];
      values[j] = temp;
   }
}

void CalculateEquityStats(
   const double &profits[],
   const double initialBalance,
   double &endingBalance,
   double &maxDrawdown
)
{
   double balance = initialBalance;
   double peak = initialBalance;
   maxDrawdown = 0.0;

   int total = ArraySize(profits);

   for(int i = 0; i < total; i++)
   {
      balance += profits[i];

      if(balance > peak)
         peak = balance;

      double drawdown = peak - balance;

      if(drawdown > maxDrawdown)
         maxDrawdown = drawdown;
   }

   endingBalance = balance;
}
5.1 How to Read the Code
In this code, tradeProfits stores profit/loss values for validation.
In a real EA, aggregate profit/loss data from tester trade history or your own logs.
ShuffleArray randomly reorders the profit/loss sequence.CalculateEquityStats calculates the ending balance and maximum drawdown after reshuffling.
5.2 Notes When Adding This to Live-Use Code
This sample is not an EA that sends orders.
If you include order processing, use MqlTradeRequest and MqlTradeResult, and design the flow so OrderCheck confirms order conditions before OrderSend.
When handling lot calculation, consider minimum lot, maximum lot, lot step, margin, tick value, and tick size.
If you validate only with fixed lots, it is easy to miss the impact of account-balance changes and drawdown.
6. Comparison by Pattern
Conclusion:
Monte Carlo analysis is easier to interpret when you compare multiple types of variation separately instead of judging by only one method.
Trade order, profit/loss error, spread deterioration, and parameter shifting each reveal different risks.
| Method | Advantages | Disadvantages | Best Use Case | Implementation Difficulty | Overfitting Risk Check |
|---|---|---|---|---|---|
| Trade-order reshuffling | Easy to review resilience when losses are clustered | Hard to reproduce market-regime time order | Checking equity-curve robustness | Low | Medium |
| Adding profit/loss error | Easy to evaluate execution differences and small cost increases | The error range must be set carefully | Validation for short-term trading EAs | Medium | Medium |
| Spread deterioration | Easy to see weakness against trading costs | Conditions vary by symbol and time of day | Scalping and high-frequency trading | Medium | High |
| Parameter shifting | Easy to check dependency on the optimized value | Hard to manage when combinations increase | Post-optimization checking | Medium | High |
| Combined scenario | Easy to create deterioration conditions close to live trading | Hard to isolate the cause | Final validation | High | High |
6.1 Check Single Conditions First
If you worsen multiple conditions at the same time from the start, it becomes hard to know which factor caused performance to break down.
Check trade order, spreads, profit/loss error, and parameter shifting individually, then check combined conditions at the end.
6.2 Decide Judgment Criteria in Advance
Before analysis, decide the acceptable maximum drawdown, minimum number of trades, maximum consecutive losses, and acceptable equity-curve deterioration.
If you change the criteria after seeing results, the validation becomes less meaningful.
7. Situations Where Analysis Can Mislead
Conclusion:
Monte Carlo analysis is a powerful validation method, but it can be misleading when input data is too limited or when reshuffling ignores market structure.
Treat analysis results as material for finding EA weaknesses, not as direct trading decisions.
7.1 Too Few Trades
When there are too few trades, statistical bias remains large even if you reorder the profit/loss sequence.
It is risky to judge logic robustness from only a few to a dozen trades.
7.2 Breaking Market-Regime Continuity
Markets include trending periods, ranging periods, high-volatility periods, and low-volatility periods.
If you fully shuffle trade order, market-regime continuity may be lost.
For that reason, also use period-based analysis.
Separating results by year, month, volatility, and time of day makes weak environments easier to find.
7.3 Underestimating Costs
If spreads, commissions, and slippage are underestimated, short-term EA performance can look better than it really is.
In live trading, spreads may widen around major news releases, lower liquidity, and rollover.
7.4 Ignoring Account-Type Differences
In MQL5, position-management rules differ between netting accounts and hedging accounts.
In a netting account, positions for the same symbol are aggregated. In a hedging account, multiple positions may be held.
When using trade history for Monte Carlo analysis, the meaning of a position can also change depending on the account type.
8. What to Check in Backtests
Conclusion:
In backtests, check not only total profit/loss but also maximum drawdown, win rate, profit/loss ratio, number of trades, consecutive losses, and period dependency.
Monte Carlo analysis supports backtest results; it is not a replacement for backtesting.
Check the following items in backtests.
- Total profit/loss
- Maximum drawdown
- Win rate
- Profit/loss ratio
- Number of trades
- Consecutive losses
- Spread conditions
- Period dependency
- Parameter dependency
- Differences by symbol
- Differences by timeframe
8.1 Emphasize Maximum Drawdown Over Total Profit/Loss
Even if total profit/loss is high, an EA with excessive maximum drawdown is hard to keep running in live trading.
The higher the leverage, the greater the margin impact tends to be for the same profit/loss movement.
8.2 Review Trade Count and Period Dependency
An EA with too few trades is more likely to be affected by random wins and losses.
If performance is good only during one short period, it may depend heavily on that market environment.
8.3 Check Parameter Dependency
Also check values around the parameters found by optimization.
If nearby values deteriorate sharply, the parameters may have been fitted too closely to historical data.
9. What to Check in Forward Tests
Conclusion:
In forward tests, check execution differences, spread widening, trade frequency, and VPS stability, which are hard to see in backtests.
Even if Monte Carlo analysis shows resilience, validation on a demo account or under small live-like conditions is still needed before live trading.
Check the following items in forward tests.
- Execution differences
- Behavior when spreads widen
- Trade frequency
- Drawdown
- Gap from the backtest
- Broker differences
- Stability in the VPS environment
- Server-time differences
- Trading-hour restrictions
9.1 Record Execution Differences
In live trading, the order price and execution price may differ.
Especially in short-term trading, even small execution differences can affect long-term performance.
9.2 Check the Gap From the Backtest
The purpose of a forward test is not to confirm the same profit as the backtest.
It is to check whether real spreads, execution, trade frequency, and drawdown stay within the expected range.
9.3 Check VPS Environment Stability
When running an EA continuously, check VPS latency, restarts, communication outages, and connection status with the trading server.
Even if the EA logic is stable, trading results can change when the operating environment is unstable.
10. Practical Notes for Live Trading
Conclusion:
Even if Monte Carlo analysis gives good results, live trading profit is not guaranteed.
Before live trading, check spreads, execution, broker specifications, account type, leverage, lot limits, and acceptable drawdown.
10.1 Backtests and Live Trading Do Not Match Exactly
Backtests reproduce trades based on historical data and configured conditions.
In live trading, execution delays, slippage, wider spreads, and server conditions can change results.
10.2 Check Lot-Calculation Safety
Consider the following items in lot calculation.
- Minimum lot
- Maximum lot
- Lot step
- Allowed risk
- Stop-loss width
- Account balance
- Equity
- Margin
- Tick value
- Tick size
- Symbol digits
| Method | Characteristics | Advantages | Disadvantages | Best Use Case |
|---|---|---|---|---|
| Fixed lot | Trades with the same lot size every time | Easy to implement | Weak against balance changes | Initial validation |
| Balance-proportional | Adjusts lot size based on balance | Easy to reflect balance increases and decreases | Needs adjustment during drawdown | Medium- to long-term validation |
| Risk-percentage based | Calculates from stop-loss width and allowed loss | Easy to manage risk | Requires handling tick information | Pre-live validation |
| Volatility-adjusted | Reflects market movement with ATR or similar data | Easy to adapt to volatile markets | Design can become complex | Symbols with large volatility differences |
10.3 Assume Order Processing Can Fail
OrderSend is the process that sends an order.
It can fail because of communication status, trading conditions, margin, price movement, or symbol specifications.
In a live-use EA, check the returned information from MqlTradeResult and keep logs when failures occur.
A practical design uses OrderCheck before sending orders so invalid orders are detected early.
11. Improvements and Alternatives
Conclusion:
If Monte Carlo analysis finds weaknesses, review the logic structure, filters, lot management, and stop conditions before further parameter optimization.
The important improvement is to identify weak market environments, not to hide performance deterioration with adjustments.
11.1 Add Filters
Adding filters for trend, volatility, time of day, and spread can reduce trades under poor conditions.
However, adding too many filters reduces trading opportunities and can cause overfitting.
11.2 Review Stop Loss and Take Profit
An EA with a stop-loss width that is too narrow can be stopped out by spreads or small price movements.
An EA with a take-profit width that is too small is more affected by trading costs.
When using a volatility indicator such as ATR, create the handle in OnInit and retrieve values with CopyBuffer in OnTick in MQL5.
If CopyBuffer does not return enough values, design the EA so it does not make a decision on that tick.
11.3 Design Stop Conditions
Stop conditions such as maximum drawdown, consecutive losses, daily loss, and weekly loss make it easier to suppress trading in abnormal market environments.
Stop conditions do not guarantee profit; they are mechanisms for controlling loss expansion.
12. Summary
Conclusion:
MT5 Monte Carlo Trading Analysis is a validation method that adds variation to EA backtest results and checks logic fragility before live trading.
It is easier to understand weaknesses when you check trade order, profit/loss error, spread deterioration, and parameter shifting separately.
In MQL5, a design that separates trading logic, order processing, history aggregation, and analysis processing is easier to handle.
For an EA that uses indicators, create handles in OnInit, use CopyBuffer in OnTick, and release them in OnDeinit when needed.
Monte Carlo analysis does not guarantee future profit.
It is important to combine backtests, Monte Carlo analysis, and forward tests, and to check spreads, execution differences, broker specifications, and acceptable drawdown.
FAQ
What is MT5 Monte Carlo Trading Analysis?
MT5 Monte Carlo Trading Analysis adds trade-order changes and profit/loss variation to EA trade results, then checks changes in the equity curve and drawdown. It is used to check backtest reproducibility and fragility.
Should I put Monte Carlo analysis directly into an MQL5 EA?
A design that separates trading logic from analysis processing is easier to handle than putting it directly into the EA. It is practical for the EA to export trade history and for the analysis side to recalculate the equity curve and drawdown.
Is it safe to trade live if Monte Carlo analysis results are good?
Monte Carlo analysis results do not guarantee live trading profit. Before live trading, check spreads, execution differences, broker conditions, and forward test results.
Why shuffle trade order?
Shuffling trade order makes it easier to check maximum drawdown when losses are clustered. Even with the same total profit/loss, money-management stress increases when losses are concentrated early.
Why is spread deterioration important?
Spread deterioration has a large impact especially on short-term EAs and EAs with many trades. If live spreads are wider than backtest spreads, expected value may decrease.
How is Monte Carlo analysis different from optimization?
Optimization searches for parameters, while Monte Carlo analysis checks how fragile the found result is. Running Monte Carlo analysis after optimization makes overfitting signs easier to detect.
What should I check in a backtest?
In a backtest, check not only total profit/loss but also maximum drawdown, win rate, profit/loss ratio, number of trades, consecutive losses, spread conditions, and parameter dependency. Judging only by total profit/loss can hide live-trading weaknesses.
What should I check in a forward test?
In a forward test, check execution differences, spread widening, trade frequency, drawdown, the gap from the backtest, and VPS stability. The goal is not a perfect match with the backtest, but whether behavior stays within the expected range.