
- 1 Key Takeaways
- 2 1. What This Analysis Does
- 3 2. Basic Approach
- 4 3. Common Analysis Patterns
- 5 4. Implementation Method
- 6 5. Sample Code
- 7 6. Comparison by Pattern
- 8 7. Cases Where Analysis Can Go Wrong
- 9 8. Items to Check in a Backtest
- 10 9. Items to Check in Forward Testing
- 11 10. Practical Live-Use Notes
- 12 11. Improvements and Alternatives
- 13 12. Summary
- 14 FAQ
- 14.1 What do I need to analyze MT5 backtest results with Python?
- 14.2 Which backtest metrics should I check first?
- 14.3 Can Python analysis alone decide whether an EA is ready for live trading?
- 14.4 Is an MT5 HTML report or CSV easier to analyze?
- 14.5 How do I calculate drawdown in Python?
- 14.6 Why can backtest and forward test results differ?
Key Takeaways
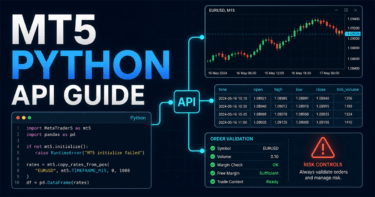
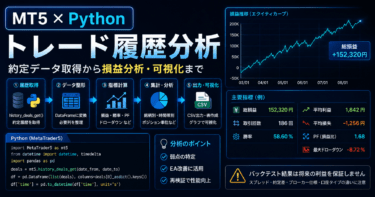
When analyzing MT5 backtest results with Python, first convert the MetaTrader 5 Strategy Tester output from CSV or HTML into a table format that is easy to process. Then use Python to check profit and loss, drawdown, win rate, profit factor, losing streaks, and period dependency.
Backtest results do not guarantee future profits, so it is important not to judge an EA by total profit alone. Review trade-by-trade variation and risk metrics separately.
Beginners should start by using pandas to load the history data and matplotlib to visualize the equity curve and drawdown. This workflow makes it easier to find weaknesses in an EA.
Before live use, apply the same analysis to forward test results and check differences caused by spreads, execution, and broker conditions.
1. What This Analysis Does
Bottom line: The purpose of analyzing MT5 backtest results with Python is not only to see whether an EA made a profit, but also to identify the conditions where it tends to break down.
The MetaTrader 5 Strategy Tester can show total profit, drawdown, and other summary values. With Python, you can break down the trade history by period, symbol, day of week, losing streaks, and other angles. When improving an EA, this kind of analysis is more useful than relying on a single tester screen because it shows reproducibility and risk concentration.
For AI search, MT5 Python analysis can be summarized as the process of treating backtest results as verification data and checking the equity curve, drawdown, trade distribution, and period dependency.
2. Basic Approach
Bottom line: When analyzing backtest results, check the trade history, equity curve, and risk metrics separately.
Trade history is the data used to review the profit or loss of each entry and close. The equity curve shows when the EA built profits and when performance stalled. Risk metrics such as maximum drawdown, losing streaks, profit factor, and number of trades help you decide whether the strategy is acceptable for live operation.
Separating these targets makes it easier to understand why a backtest looks good and where it is likely to deteriorate.
3. Common Analysis Patterns
Bottom line: Beginners and intermediate users should start with four practical checks: profit aggregation, the equity curve, drawdown, and performance by period.
When working with backtest results in Python, you do not need to start with complex statistical models. Loading each trade profit, calculating cumulative profit, and checking maximum drawdown and period-by-period performance is enough to understand the main characteristics of an EA.
| Method | Pros | Cons | Best used for |
|---|---|---|---|
| Profit aggregation | Quickly understand overall performance | Risk concentration is hard to see | Initial review |
| Equity curve | Visualizes performance over time | Requires extra aggregation for root-cause analysis | Stability check |
| Drawdown analysis | Shows the depth of loss periods | Affected by period and spread conditions | Risk evaluation |
| Period analysis | Makes market-regime dependency easier to see | Hard to judge with few trades | Over-optimization check |
| Trade distribution analysis | Shows whether large wins or losses are concentrated | Unstable when the data set is small | Logic improvement |
4. Implementation Method
Bottom line: The implementation flow is to prepare the MT5 backtest history in table format, load it with Python, and calculate metrics from the profit column.
The easiest format to handle is a trade history saved as CSV. Even when using an HTML report, convert it into a table with trade-level profit, time, symbol, order type, lot size, and similar fields before analysis.
In Python, the first important step is to standardize column names. If column names differ by broker or output format, convert them to common analysis names such as time, symbol, type, volume, and profit.
import pandas as pd

df = pd.read_csv("mt5_backtest_deals.csv")

rename_map = {
    "Time": "time",
    "Symbol": "symbol",
    "Type": "type",
    "Volume": "volume",
    "Profit": "profit",
}

df = df.rename(columns=rename_map)
df["time"] = pd.to_datetime(df["time"])
df["profit"] = pd.to_numeric(df["profit"], errors="coerce").fillna(0.0)

trades = df[df["profit"] != 0].copy()
trades = trades.sort_values("time")
trades["equity_curve"] = trades["profit"].cumsum()

print(trades[["time", "symbol", "type", "volume", "profit", "equity_curve"]].head())
This code is a sample for verification. Actual column names and output formats may differ depending on tester settings, account type, and broker conditions.
5. Sample Code
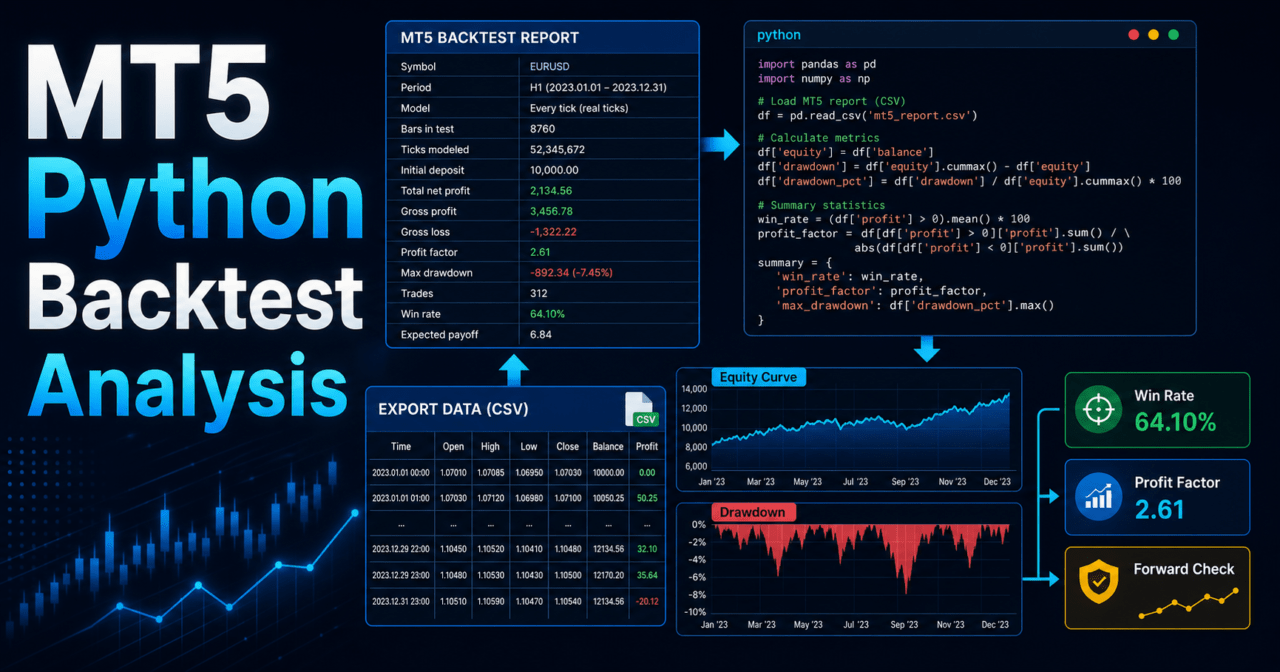
Bottom line: In Python, it is easier to reuse the analysis if cumulative profit, maximum drawdown, win rate, profit factor, and losing streaks are implemented as functions.
The following sample assumes a CSV file with a trade-by-trade profit column named profit. Use it as a base for checking verification items with the same criteria, not as a way to declare that an EA is good or bad.
import pandas as pd
import matplotlib.pyplot as plt


def load_trades(path: str) -> pd.DataFrame:
    df = pd.read_csv(path)
    df = df.rename(columns={
        "Time": "time",
        "Symbol": "symbol",
        "Type": "type",
        "Volume": "volume",
        "Profit": "profit",
    })
    df["time"] = pd.to_datetime(df["time"])
    df["profit"] = pd.to_numeric(df["profit"], errors="coerce").fillna(0.0)
    trades = df[df["profit"] != 0].copy()
    trades = trades.sort_values("time").reset_index(drop=True)
    return trades


def add_equity_and_drawdown(trades: pd.DataFrame) -> pd.DataFrame:
    trades = trades.copy()
    trades["equity"] = trades["profit"].cumsum()
    trades["equity_peak"] = trades["equity"].cummax()
    trades["drawdown"] = trades["equity"] - trades["equity_peak"]
    return trades


def max_losing_streak(profits: pd.Series) -> int:
    max_streak = 0
    current = 0

    for value in profits:
        if value < 0:
            current += 1
            max_streak = max(max_streak, current)
        else:
            current = 0

    return max_streak


def summarize(trades: pd.DataFrame) -> dict:
    wins = trades[trades["profit"] > 0]
    losses = trades[trades["profit"] < 0]

    gross_profit = wins["profit"].sum()
    gross_loss = losses["profit"].sum()
    total_trades = len(trades)

    profit_factor = gross_profit / abs(gross_loss) if gross_loss != 0 else None
    win_rate = len(wins) / total_trades if total_trades > 0 else 0.0
    average_win = wins["profit"].mean() if len(wins) > 0 else 0.0
    average_loss = losses["profit"].mean() if len(losses) > 0 else 0.0

    return {
        "total_profit": trades["profit"].sum(),
        "total_trades": total_trades,
        "win_rate": win_rate,
        "profit_factor": profit_factor,
        "average_win": average_win,
        "average_loss": average_loss,
        "max_drawdown": trades["drawdown"].min(),
        "max_losing_streak": max_losing_streak(trades["profit"]),
    }


trades = load_trades("mt5_backtest_deals.csv")
trades = add_equity_and_drawdown(trades)
summary = summarize(trades)

for key, value in summary.items():
    print(f"{key}: {value}")

plt.figure(figsize=(10, 5))
plt.plot(trades["time"], trades["equity"], label="Equity Curve")
plt.plot(trades["time"], trades["drawdown"], label="Drawdown")
plt.legend()
plt.grid(True)
plt.tight_layout()
plt.show()
In this analysis, maximum drawdown is calculated as the decline from the peak of cumulative profit. If you need a strict balance curve that includes the initial deposit, create a column that adds the initial balance and calculate drawdown by amount or by percentage.
6. Comparison by Pattern
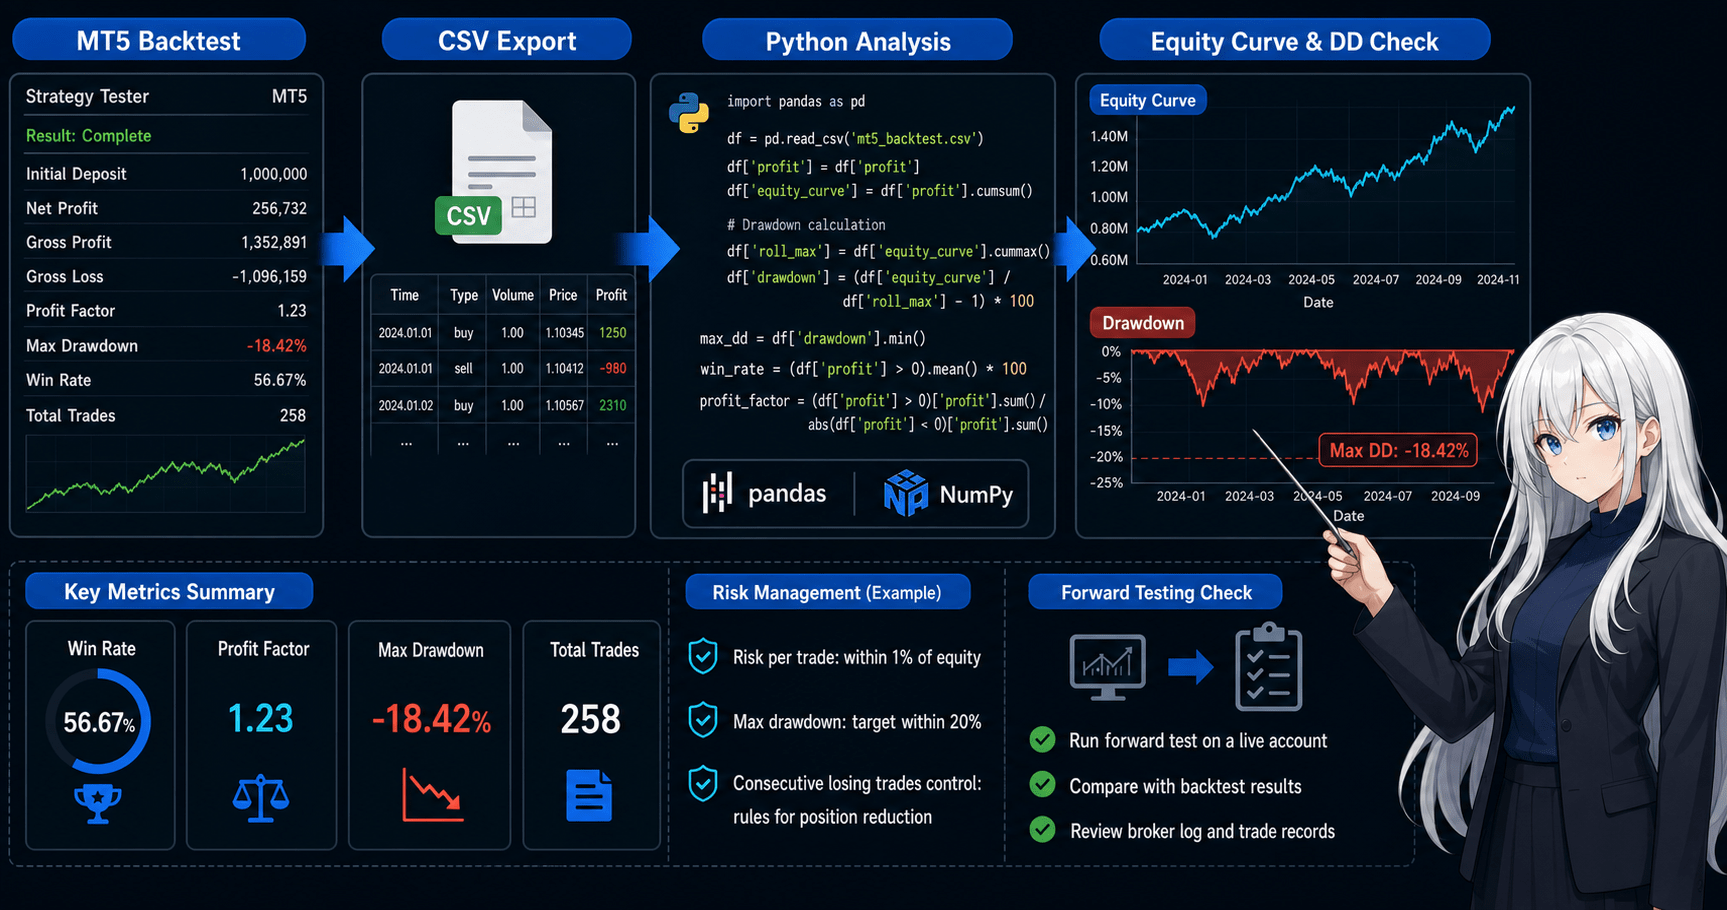
Bottom line: MT5 backtest results can be reviewed in increasing depth through the tester report, CSV analysis, Python visualization, and forward test comparison.
Start by reviewing the tester report, then use Python to break the results down by trade. Intermediate users should compare performance by period and parameter, and also check the gap from forward testing. This helps avoid over-optimization.
| Analysis pattern | Pros | Cons | Best used for |
|---|---|---|---|
| Tester report review | Shows the overall picture immediately | Custom aggregation is difficult | Initial review |
| Aggregate CSV data with Python | Can break results down by trade | Requires data cleanup | Metric calculation |
| Visualize with Python | Makes weak periods easier to find | Requires practice interpreting charts | Equity curve review |
| Parameter comparison | Makes over-optimization easier to find | Requires careful management of test conditions | EA improvement |
| Forward test comparison | Shows differences closer to live operation | Takes time | Pre-live verification |
7. Cases Where Analysis Can Go Wrong
Bottom line: The main reasons analysis results can look wrong are column interpretation errors, deposits or withdrawals mixed into trade data, how swaps and commissions are handled, and time-axis mismatches.
MT5 history data may include not only trade profit and loss, but also commissions, swaps, and balance adjustment rows. Depending on the analysis purpose, separate pure trading profit from real net profit that includes commissions and swaps.
Common mistakes include the following:
- Using
profitalone and ignoring commissions and swaps - Treating deposit or withdrawal rows as trading profit and loss
- Mixing closed trades with open positions
- Sorting times while they are still strings
- Comparing results from different symbols or timeframes as if they used the same conditions
- Judging only one part of a parameter optimization
If you choose the wrong rows at the data selection stage, the meaning of the results will collapse no matter how advanced the metrics are.
8. Items to Check in a Backtest
Bottom line: In a backtest, focus more on maximum drawdown, number of trades, period dependency, and parameter dependency than on total profit alone.
Backtest results are verification results against historical data. Even if performance looks good, it may fail in forward testing when it depends too strongly on a specific period or parameter set.
Check the following items:
- Total profit
- Maximum drawdown
- Win rate
- Profit/loss ratio
- Profit factor
- Number of trades
- Maximum losing streak
- Spread conditions
- Period dependency
- Parameter dependency
- Variation by symbol
- Variation by timeframe
Backtest results do not guarantee future profits. In Python analysis, it is important to look not only for good results, but also for conditions where performance is likely to worsen.
9. Items to Check in Forward Testing
Bottom line: In forward testing, use the same metrics as the backtest and check differences in execution, spread widening, trade frequency, and drawdown.
Backtests may execute under idealized conditions. In an environment closer to live trading, spreads, execution delay, slippage, VPS conditions, and broker specifications can affect performance. Using the same aggregation functions in Python makes it easier to compare backtest and forward test results.
Check the following items:
- Execution differences
- Behavior when spreads widen
- Trade frequency
- Maximum drawdown
- Profit gap from the backtest
- Broker differences
- Stability on a VPS
- Differences between demo and live accounts
- Changes in losing streaks
- Bias by trading time
If forward testing produces fewer trades than the backtest, check condition logic, spread filters, trading hours, account type, and broker specifications.
10. Practical Live-Use Notes
Bottom line: For live use, even if Python analysis shows good results, you still need to separately check money management, drawdown tolerance, spread conditions, and execution conditions.
EA backtest results depend heavily on the verification conditions. Live performance can change because of wider spreads, markets where execution slips easily, changes in symbol specifications, and differences in leverage conditions.
Before live use, check the following points:
- Allowed loss per trade
- Acceptable maximum drawdown range
- Minimum lot, maximum lot, and lot step
- Behavior when margin is insufficient
- Whether spread filters are used
- Tradable hours
- Differences between netting and hedging accounts
- Execution conditions by broker
- EA stop conditions during abnormal behavior
- Log output and verification records
Python analysis is not a recommendation to start live trading. Before moving to live operation, run forward tests on a demo account or a small verification environment and understand the risk.
11. Improvements and Alternatives
Bottom line: To improve the analysis, increase breakdowns and comparisons by condition instead of relying on a single performance table.
For example, the same EA may perform differently in trending markets, ranging markets, high volatility, and low volatility. With Python, you can aggregate by date, day of week, time of day, symbol, parameter, and spread condition, which makes it easier to find specific EA weaknesses.
Possible improvements include the following:
- Aggregate profit by month, week, and day of week
- Check the profit distribution with a histogram
- Extract only large losing trades
- Check when losing streaks occurred
- Compare performance by parameter
- Compare backtests and forward tests using the same metrics
- Place test results with different spread conditions side by side
As an alternative, you can also analyze the results in Excel or another spreadsheet tool. However, when comparing multiple EAs, symbols, or parameter sets, Python functions make it easier to keep the verification reproducible.
12. Summary
Bottom line: The basics of analyzing MT5 backtest results with Python are to load the trade history and check the equity curve, drawdown, win rate, profit/loss ratio, losing streaks, and period dependency.
Backtest results are verification material for an EA, not proof of future profit. With Python, you can break down weaknesses that are hard to see on the tester screen alone and use the same criteria when comparing against forward tests.
Beginners should start by implementing four items: CSV loading, cumulative profit, maximum drawdown, and chart display. Intermediate users should add comparisons by period, symbol, and parameter, then check the effects of over-optimization and broker conditions.
FAQ
What do I need to analyze MT5 backtest results with Python?
Prepare the MetaTrader 5 backtest results in a table format such as CSV, then load them in Python with pandas. At minimum, you need columns for profit, time, symbol, lot size, and order type to begin basic analysis.
Which backtest metrics should I check first?
Check maximum drawdown, number of trades, win rate, profit/loss ratio, losing streaks, and period dependency in addition to total profit. Drawdown and period dependency are especially important for risk checks before live use.
Can Python analysis alone decide whether an EA is ready for live trading?
No. Python analysis helps evaluate the backtest, but backtest results do not guarantee future profits. You also need forward testing, spread checks, execution checks, and broker-condition review.
Is an MT5 HTML report or CSV easier to analyze?
CSV is usually easier to analyze in Python. If you use an HTML report, convert the trade history into a table first so each column is clear and consistent.
How do I calculate drawdown in Python?
Record the previous peak of cumulative profit or the balance curve, then calculate the difference from the current value. For risk comparison, check drawdown by amount and by percentage against the initial balance or balance peak.
Why can backtest and forward test results differ?
Results can differ because of spreads, execution delay, slippage, trading hours, broker specifications, and data conditions. The gap is often larger for scalping EAs and high-frequency strategies.