
- 1 Conclusion
- 2 Key Takeaways
- 3 1. What Concept Drift Monitors
- 4 2. Why Concept Drift Matters for EA Model Validation
- 5 3. How Concept Drift Differs from Related Concepts
- 6 4. Common Concept Drift Patterns
- 7 5. Common Detection Methods and How to Choose
- 8 6. Turning the Concept into a Design for MQL5 Developers
- 9 7. MQL5 Example: Calculating a Lightweight Drift Score
- 10 8. How to Validate and Visualize Drift in Python
- 11 9. What to Check in Backtests, OOS Tests, and Walk-Forward Analysis
- 12 10. How to Design the Response After Drift Detection
- 13 11. Risks to Check in Live Trading
- 14 12. Common Design Mistakes
- 15 13. Implementation Steps
- 16 14. Summary
- 17 Related Topics
- 18 FAQ
- 18.1 What is concept drift detection?
- 18.2 How is concept drift different from distribution shift?
- 18.3 Is an EA drawdown evidence of concept drift?
- 18.4 Can concept drift detection be used as a trading signal?
- 18.5 Can advanced drift detection be implemented entirely in MQL5?
- 18.6 Should an EA be re-optimized automatically when drift is detected?
- 18.7 Can OOS and walk-forward testing replace concept drift detection?
- 18.8 How should a drift detection threshold be selected?
- 19 Related Research
Conclusion
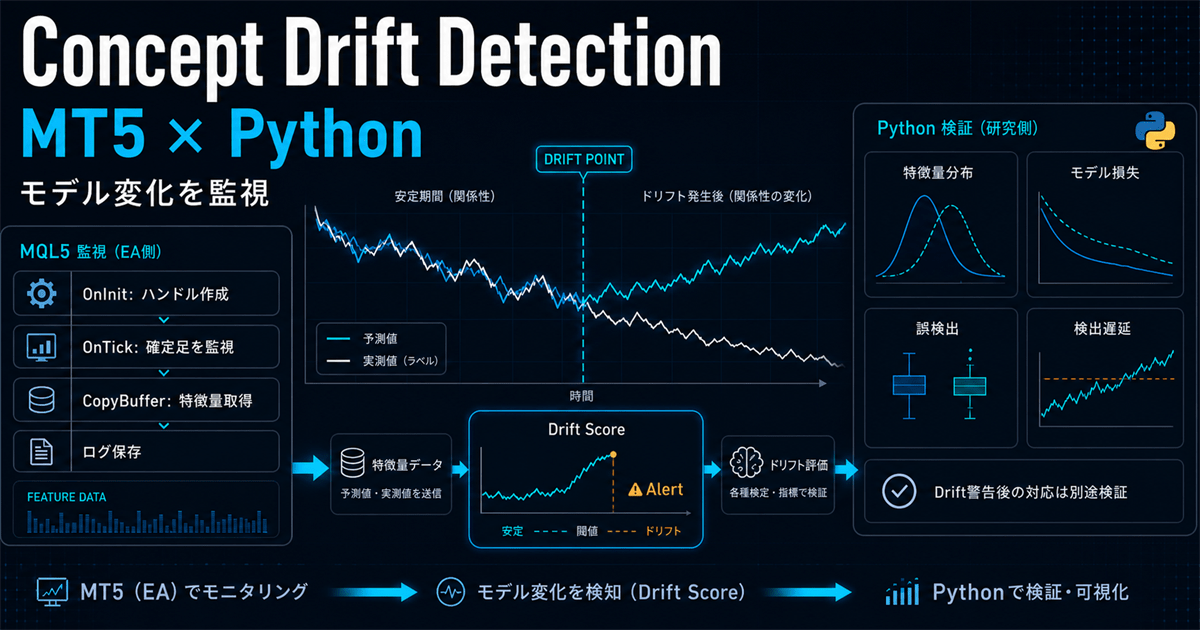
Concept drift detection monitors whether the relationship between market features and prediction targets or EA results changes over time.
A change in only the input distribution of price or volatility is evidence of covariate shift; it does not by itself prove that concept drift has occurred.
A practical architecture uses MetaTrader 5 for feature collection, lightweight monitoring, logging, and risk controls, while Python handles statistical tests, false-positive analysis, and visualization.
Treat detection results as monitoring information for deciding whether an EA can remain in operation, not as trading signals.
Key Takeaways
- Concept drift means that the relationship between features and prediction targets,
P_t(Y|X), changes over time. - Covariate shift concerns changes in the input distribution
P(X), while regime detection focuses on classifying the current market state. - Drift Alert is used for model monitoring rather than buy/sell signals, and subsequent suspension and retraining are verified separately.
1. What Concept Drift Monitors
Conclusion:
An EA can monitor relationships between features and future returns, predictions and ground-truth labels, or trading decisions and realized P&L. Being specific about what you monitor makes it easier to distinguish between simple market fluctuations and changes in model assumptions.
Definition:
Let t denote time, X the features, and Y the prediction target. Concept drift occurs when the conditional distribution P_t(Y|X) changes over time.
For example, suppose that in the past there was a relationship where “If ATR is low and the slope of the moving average is positive, it tends to rise over a certain period of time.”If that relationship is now weaker or in the opposite direction, the Concept being monitored has changed.
The purpose of Concept Drift Detection is to notify you of possible drift. It does not have the ability to predict future profits or create new entries.
1.1 Define What the EA Will Monitor First
If you make the “Concept” ambiguous in the EA, you won’t be able to explain what it detected. First fix the following three points.
- Input
X: returns, ATR, spread, volume, moving-average slope, and similar features - Target
Y: returns over the next several bars, up/down labels, or post-execution P&L - How to measure relationships: prediction error, classification error, correlation, average return by condition, etc.
If it takes time to obtain the ground-truth label, detection will also be delayed. If the target is the return over the next 10 bars, the prediction cannot be evaluated until at least those 10 bars have closed.
1.2 Monitor More Than Trading Performance
Profit and loss are important, but the smaller the number of trades, the greater the influence of chance. When examining Concept Drift, record the model’s prediction error and the EA’s trading performance separately.
Market Data
  ↓
Feature Generation ─────→ Trading Model → Trading Decision
  ↓                              ↓
Baseline Comparison       Prediction Error / Realized P&L
  ↓                              ↓
Drift Score / Alert ←──── Market and Model Monitoring
  ↓
Decision to Continue, Reduce Risk, Pause, or Reevaluate
This separation makes it easier to distinguish between “the market data has changed, but the predictive performance is maintained” and “the input distribution is similar, but the predictive performance has collapsed”.
2. Why Concept Drift Matters for EA Model Validation
Conclusion:
Financial time series do not always maintain constant properties, so past backtesting alone cannot determine their current effectiveness. Concept Drift Detection has the role of continuously checking the possibility that the operating assumptions have changed.
The logic of the EA is affected by the period, symbol, timeframe, and spread conditions selected during development. As market participants, liquidity, price movements, and execution conditions change, the relationship between previously selected features and results may change.
On the other hand, it is dangerous to judge Concept Drift only based on short-term losing streaks or drawdowns. In a finite number of transactions, profits and losses will be biased even if the relationship has not changed. Factors outside the model, such as spread widening, slippage, communication delays, and reduced trading frequency, also worsen performance.
2.1 When Detection Is Useful
- The error of the forecast model has increased continuously compared to the base period.
- Classification errors increased only under specific market conditions
- The relationship between features and future returns has become weaker.
- Predicted probabilities have become poorly calibrated between training and live operation.
- You want objective criteria for considering retraining or re-optimization.
2.2 What Detection Alone Cannot Tell You
A detector indicates that a change may have occurred; it does not automatically identify the cause or choose the best response. Even if a warning occurs, comparative validation is required in advance to determine whether to stop immediately, reduce the position size, or switch to another model.
3. How Concept Drift Differs from Related Concepts
Conclusion:
Distribution shift, or dataset shift, is the broad category for changes in the joint distribution P(X,Y) between training and deployment. Covariate shift primarily concerns changes in P(X), while concept drift concerns changes over time in P(Y|X). Regime detection and change-point detection answer different questions.
| Concept | Mainly observed | Central Question | Example in EA | Differences with Concept Drift |
|---|---|---|---|---|
| Concept Drift | P(Y|X), prediction error, and conditional performance | Does the historical relationship between inputs and outcomes still hold? | Monitor prediction error by signal | Directly monitors changes in the input–outcome relationship |
| Distribution Shift / Dataset Shift | joint distribution P(X,Y) | Has the distribution of data generation changed between training and deployment? | Comprehensive confirmation of features, labels, and the relationship between the two | Broad category that can include concept drift and covariate shift |
| Covariate Shift | P(X); P(Y|X) is generally unchanged | Has only the input feature distribution changed? | Compare ATR or return distributions | The predictive relationship is assumed to remain stable |
| Label Shift / Prior Probability Shift | P(Y) | Has the target-label proportion changed? | Compare the ratio of rising and falling labels | The perspective is different from the conditional relationship between input and label. |
| Regime Detection | market state or potential state | What is the current market situation? | Classify trends, high volatility, and low volatility | Mainly state classification |
| Change Point Detection | Change point in a statistic or data-generating process | When did the change occur? | Estimate the point at which the mean and variance change | It is necessary to separately define what relationship has changed. |
| Structural Break | Structures such as regression coefficients | Is there a clear break in the relationship? | Test feature coefficient switching | Focus on structural changes in statistical models |
| Non-stationarity | Statistical properties of the entire time series | Are properties constant over time? | Check mean, variance, and autocorrelation | Broader problem setting |
3.1 Covariate Shift Does Not Necessarily Mean Concept Drift
Even if the ATR distribution shifts higher, the observed change can be classified as covariate shift if the relationship between ATR and future returns, P(Y|X), remains stable. On the other hand, even if the distribution of ATR does not change significantly, concept drift can occur if the relationship between ATR and objective variable changes. Both are included in Distribution Shift in a broad sense, but EA monitoring separately checks whether the input has changed and whether the relationship between input and result has changed.
3.2 Regime Changes and Concept Drift Are Not One-to-One
Even if the market moves from a range to a trend, the predictive relationship will not necessarily collapse as long as the model that includes the state as an input can handle both. It cannot be concluded that the expected value of the EA has been lost just by detecting a Regime Change.
3.3 Treat Drawdown as a Reason to Investigate
Drawdowns indicate a deterioration in the profit and loss series, but are not direct evidence of Concept Drift. It is necessary to check the prediction error, feature distribution, transaction cost, execution quality, and number of transactions at the same time.
4. Common Concept Drift Patterns
Conclusion:
Concept Drift can be sudden, gradual, continuous, or recurrent. The balance between false positives and detection delay for the detection window and threshold changes depending on the expected rate of change.
| Form | Characteristics of change | Possible examples in EA | Detection precautions |
|---|---|---|---|
| Sudden Drift | change suddenly in a short period of time | The relationship between execution and price movements changes after the system change | Short windows are faster but more sensitive to noise |
| Gradual Drift | Transition with a mix of old and new relationships | The composition of market participants is gradually changing | Difficult to determine a single point of change |
| Incremental Drift | Relationships change gradually and continuously | Long-term changes in the relationship between volatility and signal outcomes | Detection is likely to be delayed in long windows |
| Recurring Drift | past relationships reappear | Old conditions recur depending on time of day and liquidity environment | Difficult to deal with simply throwing away old models |
In real financial data, noise, distribution changes, and transaction cost changes overlap. In practice, it is more important to keep a diagnostic log after a warning than to uniquely determine the form of change.
5. Common Detection Methods and How to Choose
Conclusion:
If the ground-truth label is obtained continuously, the prediction error is monitored, and if the label is delayed, monitoring of the feature distribution is used as an aid. All methods are compared under the same conditions in terms of false-positive rate, detection delay, and number of samples required.
5.1 Supervised Monitoring
If the predictions and ground-truth labels match, you can monitor misclassification, log loss, squared error, calibration error, etc. as a stream. While it is easy to directly detect changes in the relationship between inputs and objectives, in finance, finalizing the ground-truth label is delayed, and it is necessary to design labels for situations where no transactions are made.
5.2 Unsupervised Monitoring
Compare the distribution of returns, ATR, spread, and feature vectors with the reference period without using ground-truth labels. Candidates include the KS statistic, PSI, mean/variance difference, and distance measures. However, this monitoring primarily reveals changes in P(X)—evidence of covariate shift—and does not prove concept drift.
5.3 Streaming Change Detection
DDM mainly monitors the error rate of online classification. ADWIN uses statistical differences within a variable-length window to shrink old parts when changes occur. Page-Hinkley and CUSUM examine changes in the mean level from the cumulative deviation. The meaning of the warning cannot be interpreted unless you specify what statistic is being detected.
| Method | Main input | Benefits | Disadvantages | Best Use |
|---|---|---|---|---|
| Fixed window mean/variance comparison | continuous value | Easy to implement and explain | Strong dependence on window width | Lightweight primary monitoring in MQL5 |
| DDM | 0/1 misclassification | Easy to directly monitor deterioration of prediction performance | Regression and delayed labels require some ingenuity | Online monitoring of classification models |
| ADWIN | Error and continuous statistics | Adjust the window depending on the rate of change | Complex to implement and evaluate | Streaming monitoring in Python |
| Page-Hinkley / CUSUM | continuous statistics | Easy to detect small sustained changes | Sensitive to initial value and threshold | Average change in loss or residual |
| KS test/PSI | Feature distribution | Can be monitored without labels | Does not directly indicate relationship change | Checking the soundness of input data |
| Change point detection | Time series statistics | Suitable for estimating the point of change | Concept definition is required separately | Post-hoc diagnosis and interval segmentation |
5.4 Evaluate False Positives and Detection Delay Together
Lowering the threshold will give you a faster warning, but it will also make it easier to mistake normal fluctuations for drift. While increasing the threshold will reduce false positives, there is a possibility that the old model will continue to be used for a long time even after the change.
- Percentage of true changes detected
- Number of false alarms during periods of no change
- Number of bars from change occurrence to warning
- Number of re-warnings within a short period of time after a warning
- Structural delay due to label determination
- Computation time and memory usage
6. Turning the Concept into a Design for MQL5 Developers
Conclusion:
MQL5 does not need to contain the entire advanced model. It can handle feature collection on closed bars, lightweight score calculations, logging, and EA operational controls. Statistical validation, threshold search, visualization, and retraining will be easier to maintain if they are separated on the Python side.
6.1 Recommended Division of Responsibilities
| Task | MetaTrader 5 side | Python side |
|---|---|---|
| Market data acquisition | Ticks, bars, spreads, indicator values | Loading exported data |
| Feature generation | Lightweight features required for execution | Large feature sets, missing-value handling, standardization |
| Drift monitoring | Moving statistics and external scores | ADWIN, statistical tests, multivariate monitoring |
| Model processing | Inference, model ID switching | Training, retraining, threshold search |
| Operational control | Stop new entries, lot-size factor, logging | Alert diagnostics, reports, and approval flows |
| Validation | Strategy Tester, check execution conditions | OOS, walk-forward analysis, visualization |
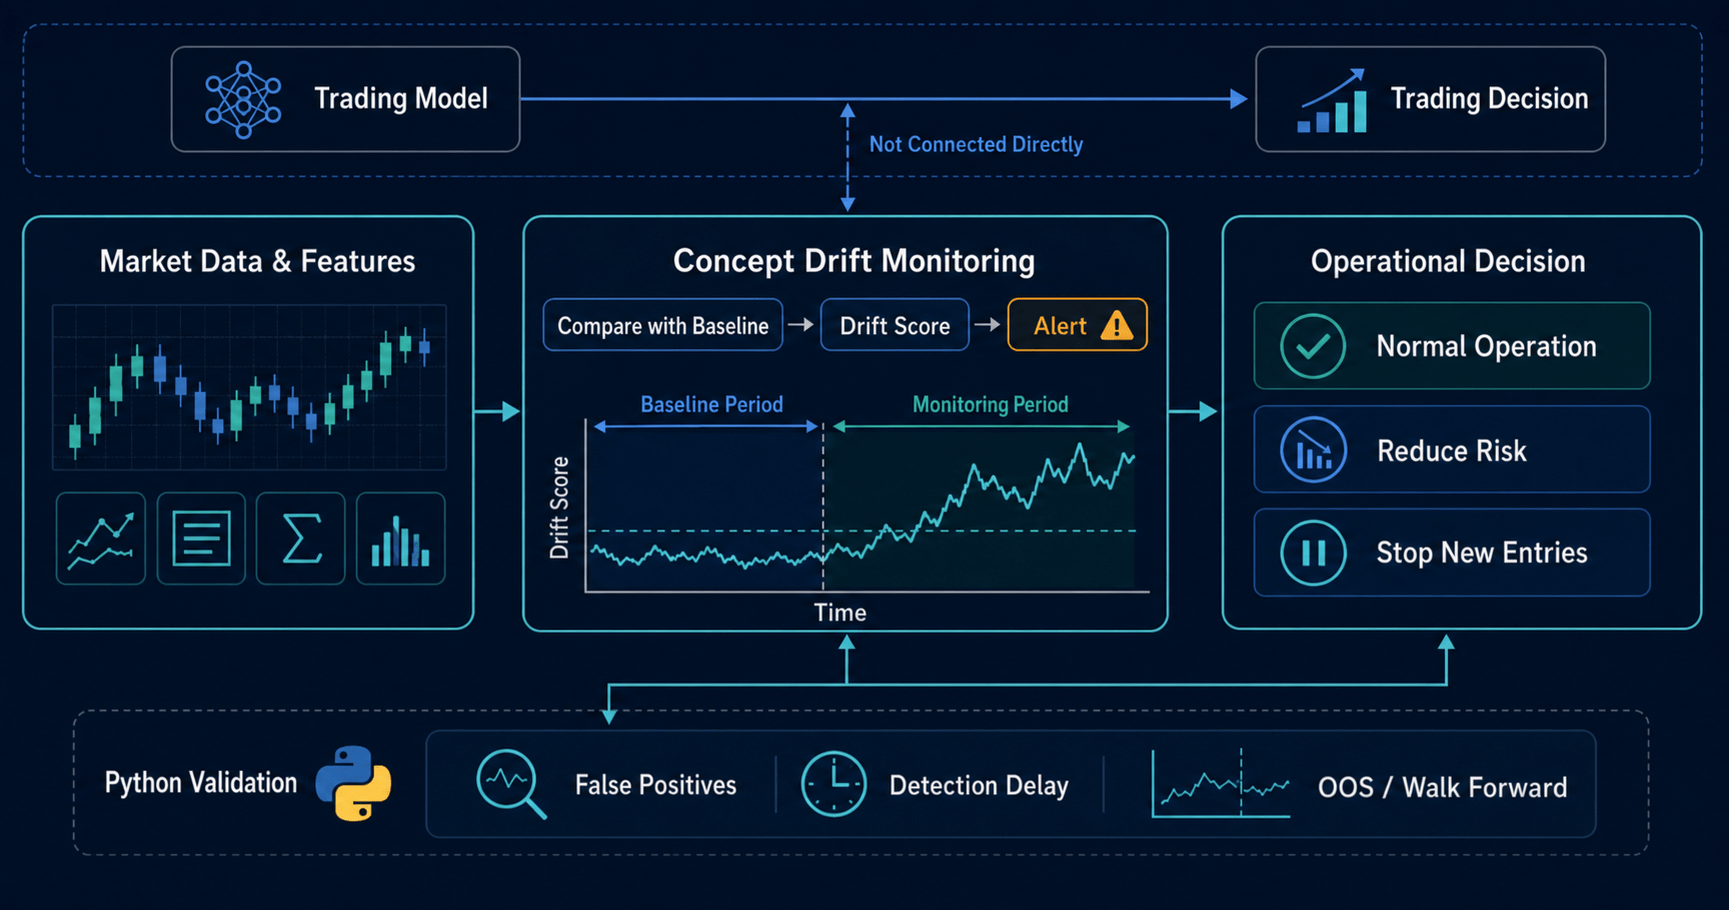
6.2 Separate Detection from Response
Trading Model
  └─ Entry and Exit Decisions

Market and Model Monitoring
  ├─ Record Features and Prediction Errors
  ├─ Update the Drift Score
  └─ Issue an Alert

Operational Control
  ├─ Normal Operation
  ├─ Reduce Risk
  ├─ Stop New Entries
  └─ Reevaluate Manually or Through an External Process
Avoid designs where the detector directly issues buy or sell orders. This is because false positives of warnings directly lead to unnecessary buying and selling.
6.3 Define State Transitions Explicitly
For example, divide the EA into NORMAL, WARNING, and PAUSED states. Do not stop after a single threshold breach; define the required consecutive breaches, recovery criteria, maximum pause duration, and manual restart conditions.
NORMAL  ──Repeated Threshold Breaches──→ WARNING
WARNING ──Sustained Normalization────────→ NORMAL
WARNING ──Sustained Deterioration────────→ PAUSED
PAUSED  ──Reevaluation Criteria Met───────→ NORMAL
7. MQL5 Example: Calculating a Lightweight Drift Score
Conclusion:
In MQL5, you can compare the old reference window and the latest window for features calculated from closed bars and calculate the standardized mean difference as a lightweight warning value. This value is a primary observation of Covariate Shift and is not a definitive determination of Concept Drift.
The following sample EA accumulates normalized ATR values from closed bars and divides the mean difference between the baseline window and the recent window by the standard deviation of the reference window. It does not include buying and selling processing, and is limited to monitoring and log output only.
#property strict

input int    AtrPeriod        = 14;
input int    BaselineBars     = 120;
input int    RecentBars       = 30;
input double WarningThreshold = 2.0;
input int    RequiredBreaches = 3;

int      atrHandle = INVALID_HANDLE;
datetime lastBarTime = 0;
double   featureWindow[];
int      consecutiveBreaches = 0;

int OnInit()
{
   if(BaselineBars < 20 || RecentBars < 5 || RequiredBreaches < 1)
   {
      Print("Invalid monitoring parameters");
      return INIT_PARAMETERS_INCORRECT;
   }

   atrHandle = iATR(_Symbol, _Period, AtrPeriod);
   if(atrHandle == INVALID_HANDLE)
   {
      Print("Failed to create ATR handle. Error=", GetLastError());
      return INIT_FAILED;
   }

   ArrayResize(featureWindow, 0);
   return INIT_SUCCEEDED;
}

void OnDeinit(const int reason)
{
   if(atrHandle != INVALID_HANDLE)
      IndicatorRelease(atrHandle);
}

void AppendFeature(const double value, const int capacity)
{
   int size = ArraySize(featureWindow);
   if(size < capacity)
   {
      ArrayResize(featureWindow, size + 1);
      featureWindow[size] = value;
      return;
   }

   for(int i = 1; i < capacity; i++)
      featureWindow[i - 1] = featureWindow[i];

   featureWindow[capacity - 1] = value;
}

double MeanRange(const int startIndex, const int count)
{
   double sum = 0.0;
   for(int i = startIndex; i < startIndex + count; i++)
      sum += featureWindow[i];
   return sum / count;
}

double StdRange(const int startIndex, const int count, const double mean)
{
   double sumSquares = 0.0;
   for(int i = startIndex; i < startIndex + count; i++)
   {
      double difference = featureWindow[i] - mean;
      sumSquares += difference * difference;
   }
   return MathSqrt(sumSquares / MathMax(count - 1, 1));
}

void OnTick()
{
   datetime currentBarTime = iTime(_Symbol, _Period, 0);
   if(currentBarTime == 0 || currentBarTime == lastBarTime)
      return;
   lastBarTime = currentBarTime;

   if(BarsCalculated(atrHandle) < AtrPeriod + 2)
      return;

   double atrValue[1];
   ResetLastError();
   int copied = CopyBuffer(atrHandle, 0, 1, 1, atrValue);
   if(copied != 1)
   {
      Print("CopyBuffer failed. Error=", GetLastError());
      return;
   }

   double closePrice = iClose(_Symbol, _Period, 1);
   if(closePrice <= 0.0 || atrValue[0] <= 0.0)
      return;

   double normalizedAtr = atrValue[0] / closePrice;
   int capacity = BaselineBars + RecentBars;
   AppendFeature(normalizedAtr, capacity);

   if(ArraySize(featureWindow) < capacity)
      return;

   double baselineMean = MeanRange(0, BaselineBars);
   double baselineStd  = StdRange(0, BaselineBars, baselineMean);
   double recentMean   = MeanRange(BaselineBars, RecentBars);
   if(baselineStd <= 1e-12)
      return;

   double driftScore = MathAbs(recentMean - baselineMean) / baselineStd;
   if(driftScore >= WarningThreshold)
      consecutiveBreaches++;
   else
      consecutiveBreaches = 0;

   bool driftAlert = (consecutiveBreaches >= RequiredBreaches);
   PrintFormat("DriftScore=%.3f Alert=%s Feature=%.8f",
               driftScore,
               driftAlert ? "true" : "false",
               normalizedAtr);

   // driftAlert is not a trading signal.
   // Pass it as a state to a separate operational control module.
}
7.1 Key Points When Reading the Code
- Use
OnInitto create the ATR indicator handle - Use
BarsCalculatedto confirm that enough bars have been calculated - Call
CopyBufferwith a start position of1to retrieve the most recently closed bar - If the number of retrieved items is less than 1, do not update the score
- Call
IndicatorReleasefromOnDeinit - Suppress single-shot noise by using continuous threshold exceedance as a warning condition
- Do not connect alert values directly to order processing
7.2 What This Code Cannot Detect
Because the code only measures the change in mean normalized ATR, it monitors only changes in P(X)—one aspect of covariate shift. Since it does not use prediction errors or relationships with future returns, it is not possible to conclude that it is Concept Drift based on this code alone.
To get closer to Concept Drift, save the prediction time, predicted value, ground-truth label finalized later, and loss in a log, and monitor changes in the loss series using Python.
8. How to Validate and Visualize Drift in Python
Conclusion:
In Python, we calculate the change in feature distribution and the change in model loss separately, and visualize false positive warnings and detection delays. The most important thing is to align the times when labels are finalized and to prevent future information from being mixed into the past.
The following example assumes that time, normalized_atr, and model_loss are stored in a CSV file. It calculates the KS statistic for the feature and the standardized mean difference for model loss. The results are validation scores, not measures of profitability.
import numpy as np
import pandas as pd
import matplotlib.pyplot as plt
from scipy.stats import ks_2samp

df = pd.read_csv("ea_monitoring.csv", parse_dates=["time"])
df = df.sort_values("time").dropna()

baseline_size = 500
recent_size = 100
feature_ks = np.full(len(df), np.nan)
loss_shift = np.full(len(df), np.nan)

for end in range(baseline_size + recent_size, len(df) + 1):
    baseline = df.iloc[end-baseline_size-recent_size:end-recent_size]
    recent = df.iloc[end-recent_size:end]

    feature_ks[end - 1] = ks_2samp(
        baseline["normalized_atr"], recent["normalized_atr"]
    ).statistic

    base_mean = baseline["model_loss"].mean()
    base_std = baseline["model_loss"].std(ddof=1)
    if base_std > 1e-12:
        loss_shift[end - 1] = (
            recent["model_loss"].mean() - base_mean
        ) / base_std

df["feature_ks"] = feature_ks
df["loss_shift"] = loss_shift

fig, axes = plt.subplots(3, 1, figsize=(12, 9), sharex=True)
axes[0].plot(df["time"], df["normalized_atr"])
axes[0].set_ylabel("Normalized ATR")
axes[1].plot(df["time"], df["feature_ks"])
axes[1].set_ylabel("Feature KS")
axes[2].plot(df["time"], df["loss_shift"])
axes[2].axhline(2.0, color="red", linestyle="--")
axes[2].set_ylabel("Loss shift")
plt.tight_layout()
plt.show()
8.1 Interpret the Two Scores Separately
- Only
feature_ksincreases: there is evidence of covariate shift, but the effect onP(Y|X)and model performance is unknown. - Only
loss_shiftincreases: the relationship may have changed in a way that simple input monitoring cannot detect. - Both increased: Possibility that Covariate Shift and model performance change occurred at the same time. Additional confirmation of whether it is Concept Drift using the label
- Both are normal, but only profit and loss worsen: Additional confirmation of execution, cost, and sample dispersion
8.2 Prevent Label Delay and Data Leakage
Future returns that were unknown at the time of prediction should not be included in the features. The model loss is added to the monitoring series when the ground-truth label is finalized. Standardization of features is also learned using only data before each point in time.
8.3 Evaluate the Detector with Synthetic Drift
Since it is often not possible to know when true Concept Drift occurs in real data, we use synthetic data in which the relationship is changed at a known point.for example, use Y = X + noise in the first half and Y = -X + noise in the second half, then measure detection delay and false alarms.
Even if synthetic data looks good, it may not yield the same results in the real market. Synthetic-data validation is a process to confirm the basic operation of the detector.
9. What to Check in Backtests, OOS Tests, and Walk-Forward Analysis
Conclusion:
We evaluate trading performance and Drift Detection performance separately. In OOS and walk-forward, the reference window, threshold, and model are determined using only past data, fixed in the future section, and verified.
9.1 Minimum Validation Conditions to Fix in Advance
- Target instruments and data providers
- Timeframe and validation period
- Tick generation method and execution method
- Spreads, commissions, and slippage
- In-sample and OOS period
- Walk-forward training window, evaluation window, update interval
- Features, objective variables, period until label determination
- Drift Score, threshold, number of consecutive judgments, cancellation conditions
- Evaluation indicators of trading performance and detection performance
9.2 Use Four Types of Validation Appropriately
| Validation | Main role | Points to see with Concept Drift monitoring | limit |
|---|---|---|---|
| Backtest | Replay the EA under historical conditions | Behavior before and after warning, log consistency | does not guarantee future profits |
| OOS validation | Evaluate fixed model with unused period | Threshold generalization, false alarms, performance changes | If there is only one section, period dependence remains. |
| Walk Forward | Repeat training and evaluation in chronological order | Relationship between retraining frequency and detection delay | The partitioning method itself affects the results. |
| Forward test | Check with current data and execution environment | Label delay, logging, execution stability | Observation takes time |
9.3 Keep Evaluation Metrics Separate
On the buy and sell side, check the total profit and loss, maximum drawdown, winning rate, profit and loss ratio, number of trades, number of losing streaks, performance by period, spread sensitivity, and parameter sensitivity. On the detection side, check the true positive rate, number of false alarms, detection delay, warning duration, number of re-warnings, and computational load.
9.4 Avoid Over-Optimization
If the threshold, window width, number of consecutive cycles, and release conditions are reselected many times in the same period, the detector itself will be over-optimized. Narrow down to a small number of explainable candidates, evaluate them with OOS, and check period dependence with walk-forward.
10. How to Design the Response After Drift Detection
Conclusion:
What to do after Drift is detected is a decision-making problem that is separate from the detection algorithm. Compare the options of retraining, reoptimizing, model switching, risk reduction, and stopping, including the loss caused by false alarms.
| Response | Benefits | Disadvantages | Conditions determined in advance |
|---|---|---|---|
| Leave only the log | Less likely to disrupt operations due to false alarms | Delay in responding to deterioration | Survey cycle and person in charge |
| Reduce position size | Easy to reduce exposure | Opportunities during normal times also decrease | Reduction rate, cancellation conditions, minimum lot |
| Stop new entries | do not introduce new risks | Lost trading opportunities due to false alarms | Handling of existing positions, maximum stop time |
| Switch to existing model | Easy to respond to recurrent changes | Selection rules are complicated | Model ID, application conditions, expiration conditions |
| Retraining/re-optimization | Can reflect new data | Leads to overfitting and frequent switching | Minimum data count, OOS passing conditions, approval procedure |
Even when retraining is automated, it is safe to design a system that does not immediately reflect the new model in the live account. Evaluate candidate models in OOS, walk-forward, demo, or low-risk forward environments and switch only when passing criteria are met.
11. Risks to Check in Live Trading
Conclusion:
Even with the addition of Drift monitoring, losses and drawdowns are inevitable. We check whether the EA can transition to the safe side, assuming false alarms from the detector, detection delays, data loss, and changes in the execution environment.
11.1 Trading Costs and Execution Differences
Spreads, commissions, slippage, and execution delays may differ between backtesting and live trading. Even if the predictive performance of the model remains the same, realized profits and losses may worsen due to increased costs. Market model drift and execution quality deterioration are monitored in separate logs.
11.2 Broker and Account Specifications
Minimum lot, maximum lot, lot step, stop level, freeze level, and trading time vary by instrument and broker. If the calculation result during risk reduction is less than the minimum lot, it is necessary to decide not to place a new order. The method of managing existing positions is also different for netting and hedging accounts.
11.3 Suspension Logic and Existing Positions
“Stopping new entries” and “immediate closing of existing positions” are not the same. Define in advance how existing positions will be handled in the event of a warning, including the spread cost and reduced liquidity when closing them.
11.4 Data Quality and Time Synchronization
Missing bars, duplicate data, server time, daylight saving time, and delays in CSV output can lead to false alarms. If the reference window is designed to disappear after restarting the VPS, initialization conditions such as suspending trading until sufficient data has been re-accumulated are required.
11.5 Capital and Leverage
High leverage means that even small price fluctuations can greatly affect account profits and losses. Limit the maximum drawdown, allowable loss per trade, and total exposure in a separate risk management module, subject to the possibility of delayed drift warnings.
Backtest results do not guarantee future profits. Before live trading, forward testing including execution conditions is required.
12. Common Design Mistakes
Conclusion:
The most common design mistake is to conclude that it is Concept Drift based on the signs of Covariate Shift, and then directly link a single warning to ordering or re-optimization. Separate and record monitoring targets, labels, thresholds, and response conditions.
- Judged as Concept Drift based on temporary drawdown alone
- It is concluded that the predictive relationship is broken simply due to changes in ATR or price distribution.
- Update the score many times with the value of the unconfirmed bar
- Incorporating future data that was unknown at the time of prediction into the features
- Mix detection indicators and EA profit/loss indicators
- Repeatedly optimize window width and threshold in the same period
- Unconditionally close all positions with one warning
- Do not determine warning cancellation conditions or recovery conditions after reboot
- Reflect the retrained model in live trading without OOS evaluation
- Mistaking spread or execution differences as the model’s Concept Drift
13. Implementation Steps
Conclusion:
We start with a monitoring mode that records one feature and one prediction loss and only issues a warning. Verify detection performance and then connect to step-by-step risk control.
- EA input
X, targetY, prediction time, and label confirmation time are defined. - Record closed-bar features, predicted values, model IDs, and spreads in MQL5
- Record prediction loss after the label is finalized
- Visualize feature distribution and loss series separately in Python
- Measuring false alarms and detection delays with synthetic drift
- Divide past data in chronological order and evaluate thresholds with OOS and walk-forward
- Log only warnings in forward environment
- After confirming operational effects and side effects, connect to risk reduction or suspension.
14. Summary
Concept drift detection monitors whether the historical relationship between features and prediction targets or EA results, P_t(Y|X), still holds. Distribution shift broadly describes changes in P(X,Y). Covariate shift is the case in which the input distribution P(X) changes while P(Y|X) generally remains stable. Regime detection and change-point detection address the different questions of state classification and change timing.
MetaTrader 5 is suitable for feature acquisition, lightweight monitoring of fixed bars, log storage, and EA operation control. Python is suitable for monitoring prediction errors, statistical testing, visualization, threshold selection, and OOS/walk-forward evaluation.
Detectors have false alarms and detection delays. It is important not to use warnings as buy/sell signals, but to use other validated rules to determine whether to retrain, switch models, reduce risk, or stop.
Related Topics
- Difference between Concept Drift and Distribution Shift
- EA design to record Drift Score with MQL5
- Model monitoring using ADWIN in Python
- How to apply Change Point Detection to financial time series
- Regime Detection and EA state management
- How to verify model degradation with walk-forward analysis
FAQ
What is concept drift detection?
Concept Drift Detection is a method of monitoring whether the relationship between input and prediction target has changed over time. An EA can monitor the relationship between features and future returns, predictions and ground-truth labels, and trade decisions and realized results.
How is concept drift different from distribution shift?
Distribution shift is the broad category for changes in the joint distribution P(X,Y) between training and deployment. Covariate shift occurs when the input distribution P(X) changes while P(Y|X) generally remains stable; concept drift occurs when P(Y|X) itself changes over time.
Is an EA drawdown evidence of concept drift?
Drawdown alone is not evidence of Concept Drift. Sample dispersion, spread, slippage, execution delays, and a decrease in the number of trades can also worsen profits and losses, so we check forecast errors and data distribution separately.
Can concept drift detection be used as a trading signal?
Concept Drift Detection is basically separated from buy and sell signals as market/model monitoring. Warnings are treated as information to consider whether to continue operation, reduce risk, stop, or reevaluate.
Can advanced drift detection be implemented entirely in MQL5?
Lightweight moving statistics and the use of external scores can be implemented in MQL5. It is easier to verify and maintain multivariate statistical validation, training, visualization, and threshold search by separating them into the Python side.
Should an EA be re-optimized automatically when drift is detected?
Automatic reoptimization is not always appropriate. The new model may overfit, so make sure the OOS, walk-forward, and forward tests pass before switching.
Can OOS and walk-forward testing replace concept drift detection?
It is not a replacement. OOS and walk-forward evaluate the temporal generalization of development and update procedures, and Concept Drift Detection has the role of continuously monitoring changes during operation.
How should a drift detection threshold be selected?
It uses synthetic drift and chronological OOS data to balance the number of false alarms and detection delay. The final evaluation period is separated because repeatedly adjusting the threshold in the same period tends to lead to over-optimization.